
Feeling like you're just shouting into the social media void? You're not alone. So many freelancers, consultants, and startup founders I talk to are stuck in the same boat, drowning in a sea of data without a clear map.
You're constantly posting, engaging, and trying to grow, but it feels like you're just spinning your wheels. The real problem? Measuring success isn't about counting likes. It's about connecting what you do on social media to actual business results.
Chasing "vanity metrics" like follower counts or likes is a trap. I’ve seen it a hundred times. A post gets a flurry of engagement but doesn't lead to a single website click or a new lead. It feels good, but it doesn't pay the bills. This guide is here to cut through that noise.
"The goal is not to be good at social media. The goal is to be good at business because of social media." – Jay Baer, Marketing Expert
This is the mindset shift that changes everything. Every single piece of data you look at should help you answer one question: How is this helping my business grow?
To really get a handle on this, you need a solid, repeatable framework. This guide lays out a clear roadmap, built specifically for busy professionals who use platforms like LinkedIn to build their brand and their bottom line.
Here’s what we’ll actually get done:
- Set goals that matter: We're moving past vague ideas like "get more engagement" and into specifics, like "generate 10 qualified leads a month from my LinkedIn content."
- Track the right numbers: You’ll learn to focus on the key performance indicators (KPIs) that directly show you’re making progress.
- Make sense of the data: It's not just about looking at numbers. It's about understanding what they mean so you can tweak your content, sharpen your targeting, and nail your overall strategy.
By the end of this, you won't just be collecting data—you'll be using it to tell a powerful story about the impact you're making. You'll finally have the confidence to show the value of your social media efforts and make smart decisions that fuel real, sustainable growth.
Let’s put your data to work.
Aligning Your Goals with Actionable KPIs
Trying to measure social media success without knowing what you're aiming for is like driving blind. Sure, you're moving, but you have no idea if you're getting anywhere useful. I see it all the time with freelancers and consultants—they get caught up in the motion but forget the destination.
Real measurement starts long before you open an analytics dashboard. It begins by getting crystal clear on what you actually want to achieve. For most of us, that means ditching vague goals like "more engagement" and translating our big business objectives into sharp, measurable social media goals. The old-school SMART framework (Specific, Measurable, Achievable, Relevant, Time-bound) is your best friend here.
This whole process is a loop, not a straight line. You set goals, take action, measure, and then use those insights to refine your next move.
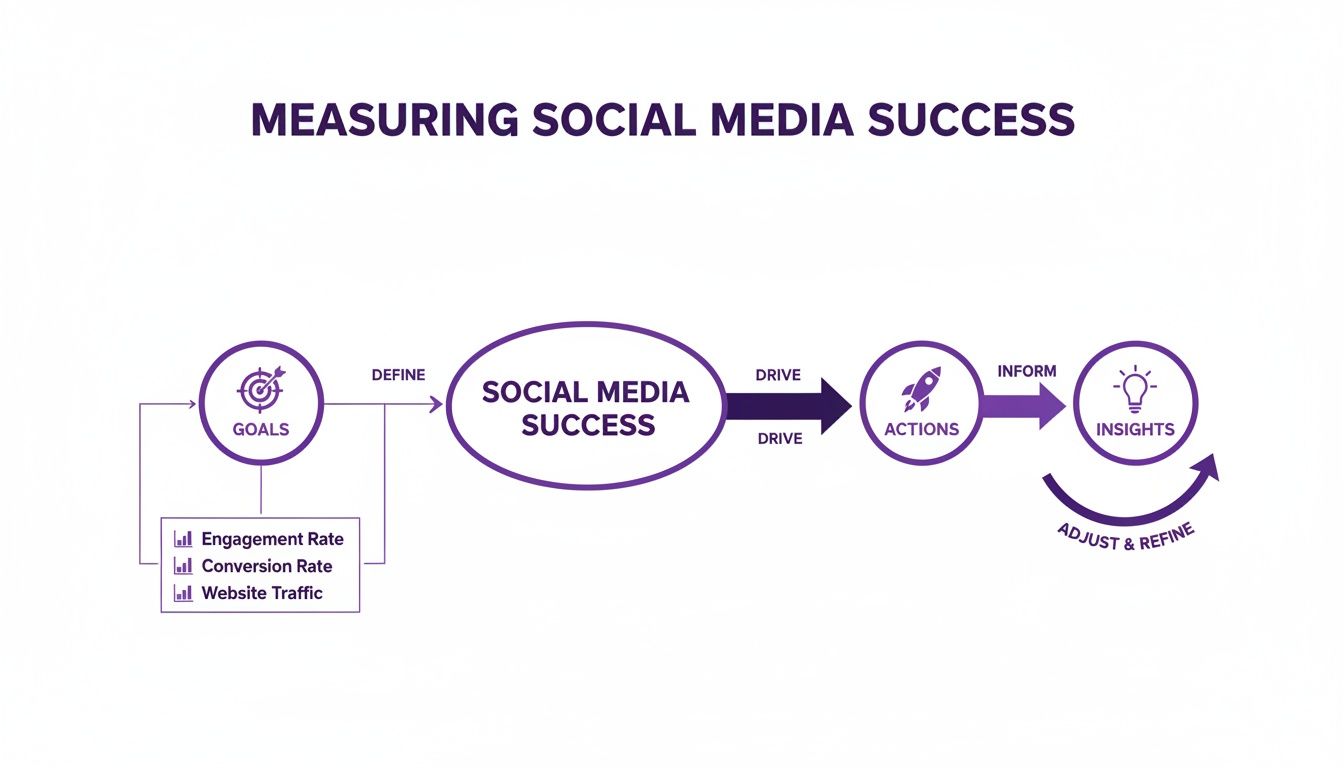
This cycle is the engine of any successful strategy. It’s about constantly learning and adapting based on real data, not just gut feelings.
From Business Objectives to Social Media Goals
Your LinkedIn activity should never be an island. It has to tie directly back to what moves the needle for your business. Let's break down what this looks like in the real world for professionals trying to build their brand.
Big Business Objective: Increase Brand Awareness
- Your Social Media Goal: Become the go-to expert in your niche. A smart goal here could be to increase your content's reach among VPs of Marketing by 20% over the next quarter.
Big Business Objective: Generate Qualified Leads
- Your Social Media Goal: Get potential clients to book a call or visit your services page. A solid goal might be to generate 15 qualified leads from your LinkedIn posts within 30 days.
Big Business Objective: Foster Community Engagement
- Your Social Media Goal: Build a real, active network of peers and prospects. This could mean aiming to increase the average number of comments on your posts by 30% over the next two months.
Once that sharp, time-bound goal is in place, you can finally pick the right Key Performance Indicators (KPIs) to track your progress. A KPI isn't just any metric; it's the specific metric you've handpicked because it tells you if you're on track to hit your main objective.
Think of it this way: all KPIs are metrics, but only the most important metrics get to be KPIs. They're the vital signs of your entire social media effort.
Matching Social Media Goals to the Right KPIs
Choosing the right KPIs is so critical because it keeps you from getting distracted by shiny "vanity metrics." If your goal is to land new clients, who cares if a post gets 1,000 likes if it didn't generate a single click to your website? The KPI must match the goal.
To make this easier, here’s a quick-reference table to help you connect your high-level business goals with the specific social media KPIs you should actually be tracking.
Matching Social Media Goals to the Right KPIs
| Business Objective | Primary Social Media KPI | Example Metric | Best Platform (Example) |
|---|---|---|---|
| Increase Brand Awareness | Reach / Impressions | Number of unique accounts that saw your post | LinkedIn for B2B, Instagram for B2C |
| Generate Qualified Leads | Click-Through Rate (CTR) | Percentage of viewers who clicked your link | LinkedIn or a targeted Facebook Ad |
| Drive Website Traffic | Traffic from Social | Number of sessions from a specific platform | Any platform with link-in-bio or swipe-up |
| Foster Community | Engagement Rate | (Likes + Comments + Shares) / Followers | Niche Facebook Groups or LinkedIn |
| Improve Brand Perception | Sentiment Analysis | Ratio of positive to negative mentions | X (formerly Twitter) or public forums |
This isn't an exhaustive list, but it gives you a solid framework for thinking about what to measure based on what you want to achieve.
Let’s dig into which KPIs line up with our earlier examples.
For the brand awareness goal, you need to know how many eyeballs are on your content and how far it's spreading. Your go-to KPIs would be:
- Reach: The number of unique people who saw your post. Simple and powerful.
- Impressions: The total number of times your content was shown. It's important to understand the difference between views vs. impressions to get the full picture.
- Share of Voice: A bit more advanced, this looks at how much of the conversation around your industry topic features you versus your competitors.
For the lead generation goal, your focus completely shifts from eyeballs to action. You're now tracking how well your content actually persuades people to take that next step.
- Click-Through Rate (CTR): The percentage of people who saw your post and actually clicked the link. This is a direct measure of how compelling your headline and offer are.
- Conversion Rate: The percentage of people who clicked through and completed the desired action, like signing up for your newsletter. This is where the money is.
- Cost Per Lead (CPL): If you’re running ads, this metric is non-negotiable. It tells you exactly how much you're spending to get each new lead.
By tying your goals to these specific, actionable KPIs, you build a real framework for measuring what matters. This is how you stop guessing and start knowing, for sure, if your social media is actually working.
Tracking the Metrics That Actually Matter
Once you have your goals locked in, it’s time to get your hands dirty with the numbers. I’ve seen so many freelancers and consultants get completely overwhelmed here, staring at a dashboard full of jargon. But trust me, understanding the right metrics isn't about becoming a data scientist; it's about knowing which numbers actually tell the story of your progress.
Let's break down the essentials into logical groups. We'll start with general brand visibility and move all the way down to specific, money-making actions. This is how you stop guessing and start measuring what truly impacts your business.
Measuring Your Brand's Visibility
Before anyone can hire you, they have to know you exist. It’s that simple. Awareness metrics tell you how many people are seeing your content and how far your message is spreading. These are your foundational numbers.
Reach: This is the number of unique people who saw your post. Think of it as the size of your audience for that specific piece of content. When your reach is high, it’s a great sign that your content is breaking out beyond your immediate followers.
Impressions: This is the total number of times your content was displayed on a screen, regardless of clicks. A single person could see your post three times, which would count as 1 reach but 3 impressions. High impressions are great for building brand recall—you’re consistently showing up in people's feeds.
For a consultant on LinkedIn, a post that hits 10,000 in reach is a solid indicator their expertise is gaining real traction in their target industry.
Understanding Audience Interaction and Engagement
This is where the magic happens. Engagement metrics tell you if people are actually paying attention. Are they just scrolling by, or are they stopping to interact? This is a crucial signal of genuine interest.
The king of these metrics is the engagement rate. In 2025, you'll see average rates floating between 1.3% and 3.5% across most platforms. But that varies wildly—LinkedIn, for example, can see a massive 6.6% engagement on multi-image posts, making it a powerhouse for B2B pros. For more context, check out these social media statistics.
But here’s a pro tip: not all engagement formulas are created equal. The distinction is critical.
Engagement Rate by Followers:
(Likes + Comments + Shares) / Total Followers * 100This is the most common formula, but frankly, it can be misleading. It pits your engagement against your entire follower base, including inactive accounts or people who never even saw the post.Engagement Rate by Reach:
(Likes + Comments + Shares) / Reach * 100This is the one you should care about. It measures engagement based on the people who actually saw the post, giving you a much truer sense of your content's quality. A high rate here means your content is genuinely compelling to those who see it.
A post with a low engagement rate by followers but a high engagement rate by reach isn't a failure—it's a distribution problem. The content itself is good; it just needs to get in front of more of the right people.
Beyond that core rate, two other metrics give you a more nuanced picture:
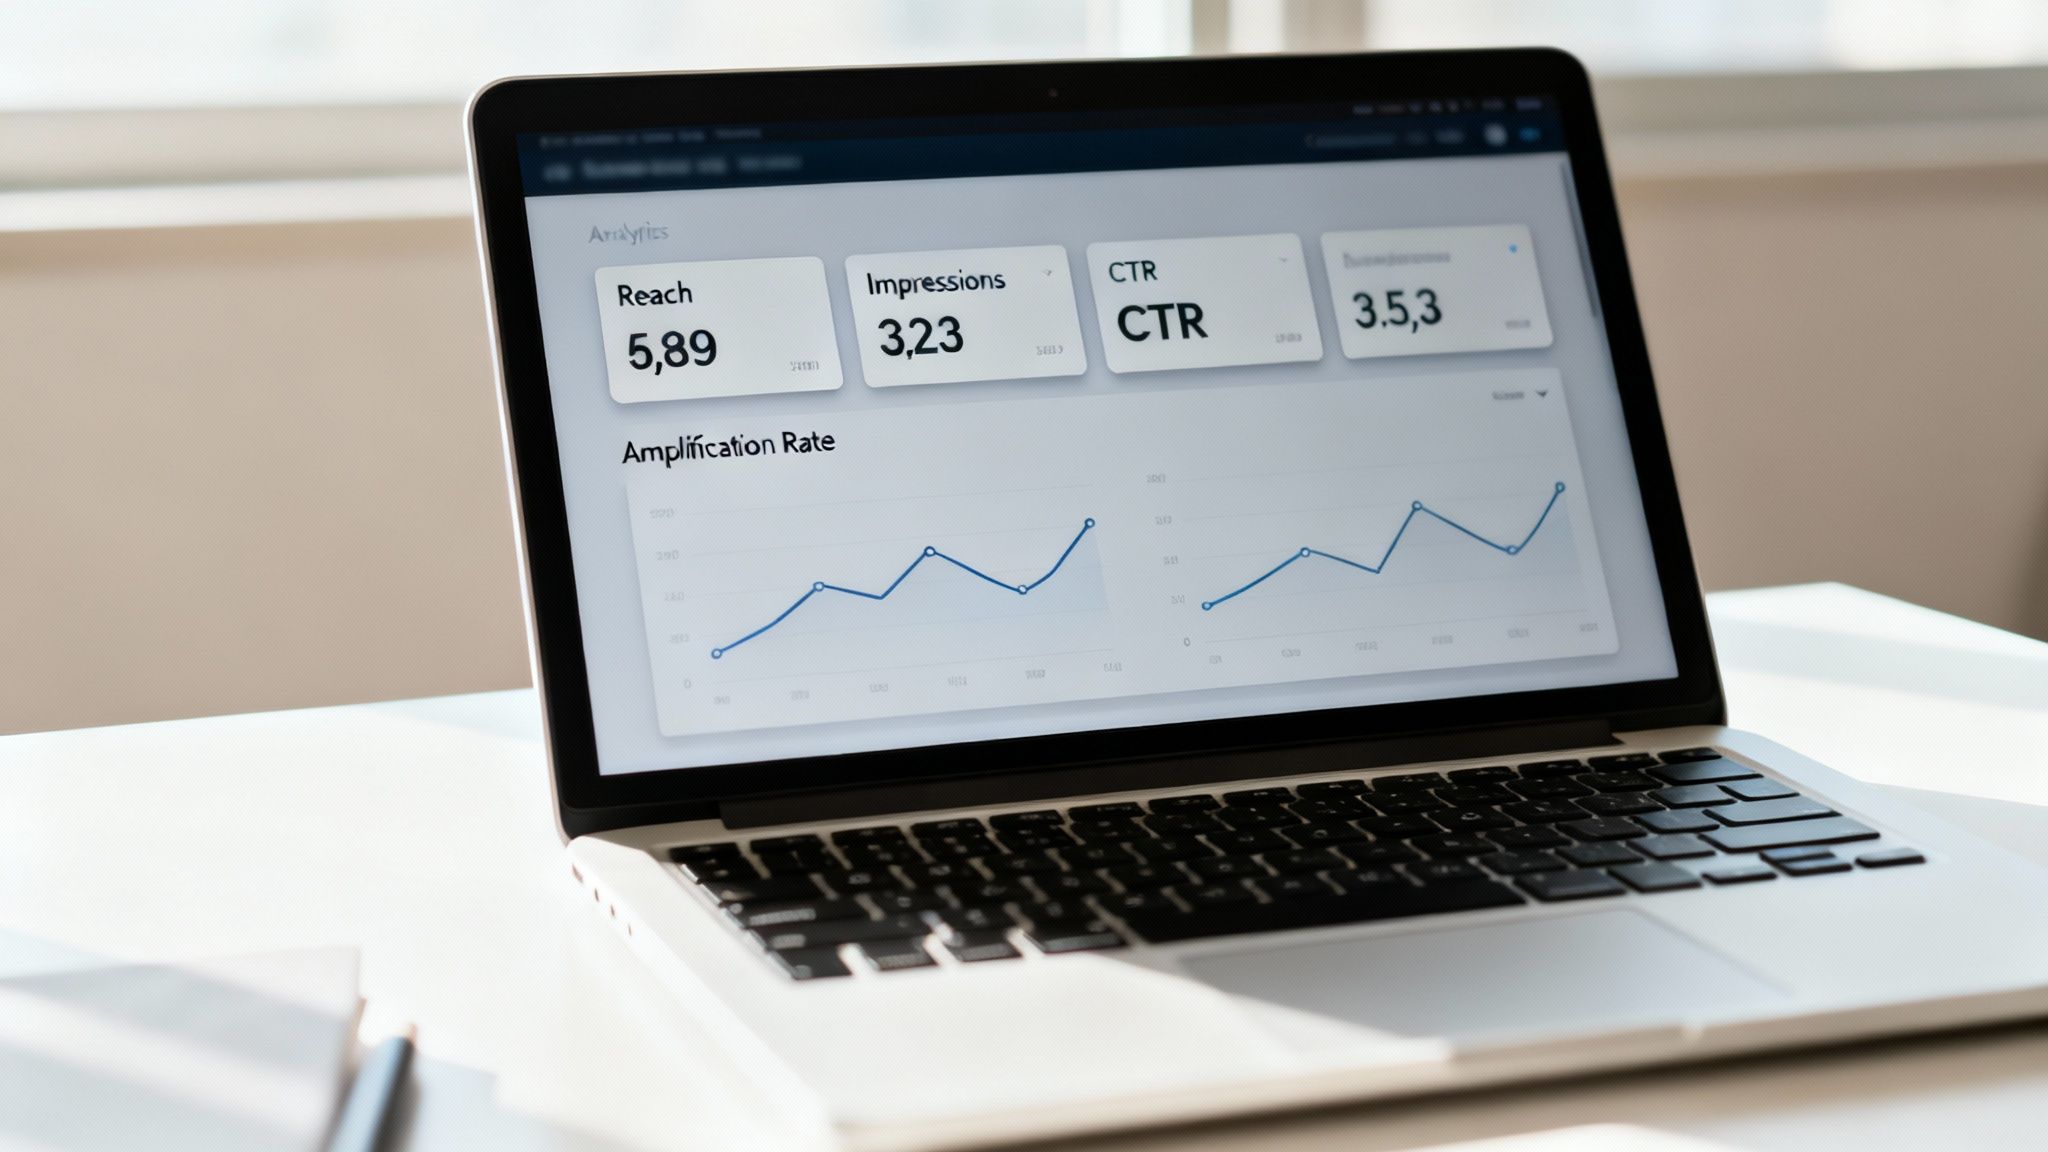
Amplification Rate: This measures how many shares you get relative to your followers. A high amplification rate, especially on LinkedIn, is gold. It means your audience finds your content so valuable they’re willing to stake their own reputation on it by sharing it with their network.
Applause Rate: This is a simpler one, just looking at approval actions like likes or favorites. It’s not deep, but it’s a quick pulse check to see if your content is hitting a positive note.
Tracking Action and Conversion
At the end of the day, social media has to drive real business outcomes. Conversion metrics are what connect your social efforts directly to things like website traffic, new leads, and sales. This is where you prove your ROI.
If you're serious about your business, these numbers are non-negotiable.
Click-Through Rate (CTR): The percentage of people who saw your post and actually clicked the link. A high CTR tells you your headline and call-to-action were on point—you sparked enough curiosity to get the click. For a deeper dive, check out our guide on how to analyze content performance.
Cost-Per-Click (CPC): If you're running ads, this is your lifeline. It tells you exactly how much you're paying for every single click. The goal is always to drive this number down without sacrificing the quality of your audience.
Conversion Rate: This is the ultimate bottom-line metric. It tracks the percentage of people who clicked your link and then completed a specific goal on your site—signing up for your newsletter, downloading a guide, or booking a call.
By tracking a balanced mix of these awareness, engagement, and conversion metrics, you move beyond just posting and hoping. You start building a complete, data-driven picture of what’s working, what isn't, and exactly where to focus your energy for the biggest impact.
Calculating Your Social Media Return on Investment
Sooner or later, every client, manager, or stakeholder asks the big question: is our social media investment actually paying off? This is where we move past vanity metrics like likes and shares. Calculating your social media Return on Investment (ROI) is how you connect your LinkedIn activity directly to the bottom line.
It’s the single most powerful way to shift social media from a "nice-to-have" expense into a proven, undeniable revenue driver.
Measuring ROI sounds more intimidating than it is. The core idea is simple: you’re just comparing the money you made from social media against what you spent to make it happen.
The basic formula is straightforward:
(Profit from Social Media - Total Social Media Cost) / Total Social Media Cost x 100 = Social Media ROI %
A positive percentage means you're in the black. Negative means you're in the red. The real work isn't in the math, but in accurately tracking both sides of that equation.
Tallying Up Your Total Social Media Costs
To get a real picture of your investment, you have to account for every single dollar spent. I see it all the time—freelancers and consultants only track the obvious stuff like ad spend, which gives them an incomplete and often wildly inflated sense of their ROI.
Let’s break down the costs you absolutely must include:
- Your Time (or Your Team's): This is the one everyone forgets. Your hours are valuable. You need to assign an hourly rate to the time you spend creating content, scheduling posts, engaging with your audience, and analyzing the results.
- Social Media Tools: Think subscription fees for schedulers like PostFlow, analytics platforms, or design software. These are direct, hard costs.
- Ad Spend: This one’s easy—it’s the cash you're paying directly to platforms like LinkedIn for sponsored posts and ad campaigns.
- Content Creation Expenses: Did you hire a freelance video editor for a few hours? Purchase some stock photos? Those expenses go into the bucket.
Add all of this up, and you’ve got the "Total Social Media Cost" part of the formula. Now your calculation is grounded in reality.
Putting a Price Tag on Your Conversions
Now for the other side of the equation: profit. This is simple if a click leads directly to an online purchase. But for most of us—consultants, coaches, and service-based businesses—a "conversion" is often a few steps removed from the final sale. It might be a lead form submission, a demo booking, or a guide download.
To solve this, you just need to work backward. Once you understand your sales pipeline, you can assign a clear monetary value to these intermediate steps.
A great way to do this is with Customer Lifetime Value (CLV). Let's say you know that, on average, a new client is worth $5,000 to your business over their lifetime. If you typically close 1 out of every 10 qualified leads you speak with, then each of those qualified leads is worth $500 ($5,000 / 10). Suddenly, every single lead generated from LinkedIn has a tangible dollar value attached to it.
Putting It All Together: A Real-World Example
Let’s imagine a B2B consultant who uses LinkedIn to generate leads for her $10,000 coaching package. Over a single quarter, she tracks absolutely everything:
- Total Costs: $500 in LinkedIn ads + $100 for her PostFlow subscription + $1,400 for her time (20 hours at $70/hr) = $2,000 total investment.
- Results: Her campaign generated 8 qualified leads who booked a discovery call through a link in her LinkedIn posts.
- Conversions: She crushed it and converted one of those leads into a new client, generating $10,000 in fresh revenue.
Now, we just plug it all into our formula: ($10,000 - $2,000) / $2,000 * 100 = 400%.
Her social media ROI for the quarter was a massive 400%. That's a number she can take to the bank.
Beyond the baseline ROI, it’s also smart to look at metrics like return on ad spend (ROAS). Honestly, ROAS and conversion metrics are where the rubber meets the road, linking your efforts directly to revenue. With social ad spend projected to blow past $406 billion by 2029, tracking tangible impact is no longer optional. For a little inspiration, top performers on platforms like Instagram Shops can see an incredible 5-8x ROAS, showing just how powerful connecting ad dollars to direct sales can be.
If you want to go even deeper, I highly recommend this guide on measuring social media ROI like a pro.
Turning Data Into Decisions: Your Social Media Dashboard
Raw data is just noise. I’ve seen countless freelancers and consultants get bogged down in endless metrics without a clear picture of what’s actually working. To really measure your social media success, you need to translate those scattered numbers into a clear, understandable story.
This is where a dashboard comes in. Think of it less like a complex, enterprise-level tool and more like your personal command center, designed to turn raw data into actionable insights.
You don’t need to spend a fortune on fancy software to get started. Simple tools like Google Sheets or Looker Studio, fed with data from LinkedIn's native analytics, are more than enough. The real goal here is building a repeatable process that makes your performance data a strategic asset, not just a monthly chore.
What Story Does Your Dashboard Need to Tell?
A one-size-fits-all dashboard is a recipe for confusion. The metrics that matter for brand awareness are just distractions if your goal is lead generation. Your dashboard needs to mirror your primary objective, telling you exactly what you need to know at a single glance.
Let’s look at two common scenarios for a consultant on LinkedIn:
The Brand Awareness Dashboard: This is all about getting seen by the right people. The key question is, "Are more of my ideal clients seeing my content?" Your dashboard should put metrics like Reach, Impressions, and Follower Growth Rate front and center.
The Lead Generation Dashboard: This one is all about driving action. Here, you're asking, "Is my content compelling people to take the next step?" You'll want to highlight your Click-Through Rate (CTR), Website Referral Traffic, and the Conversion Rate from your social channels.
When it comes to brand awareness, reach rate is a metric I always keep an eye on. It cuts through the noise of impressions to show you what percentage of your actual audience saw your post. It's a powerful indicator of how well your content is resonating with the algorithm.
How to Structure Your Dashboard for Clarity
Once your focus is clear, organizing the dashboard is pretty straightforward. The key is visualization—making the data easy to digest for anyone, even if they aren't a social media guru. You want them to grasp the takeaways in seconds, not minutes.
This is where creating powerful data visualization dashboards can transform your reporting from a simple data dump into your brand's command center for growth.
A simple but highly effective structure looks like this:
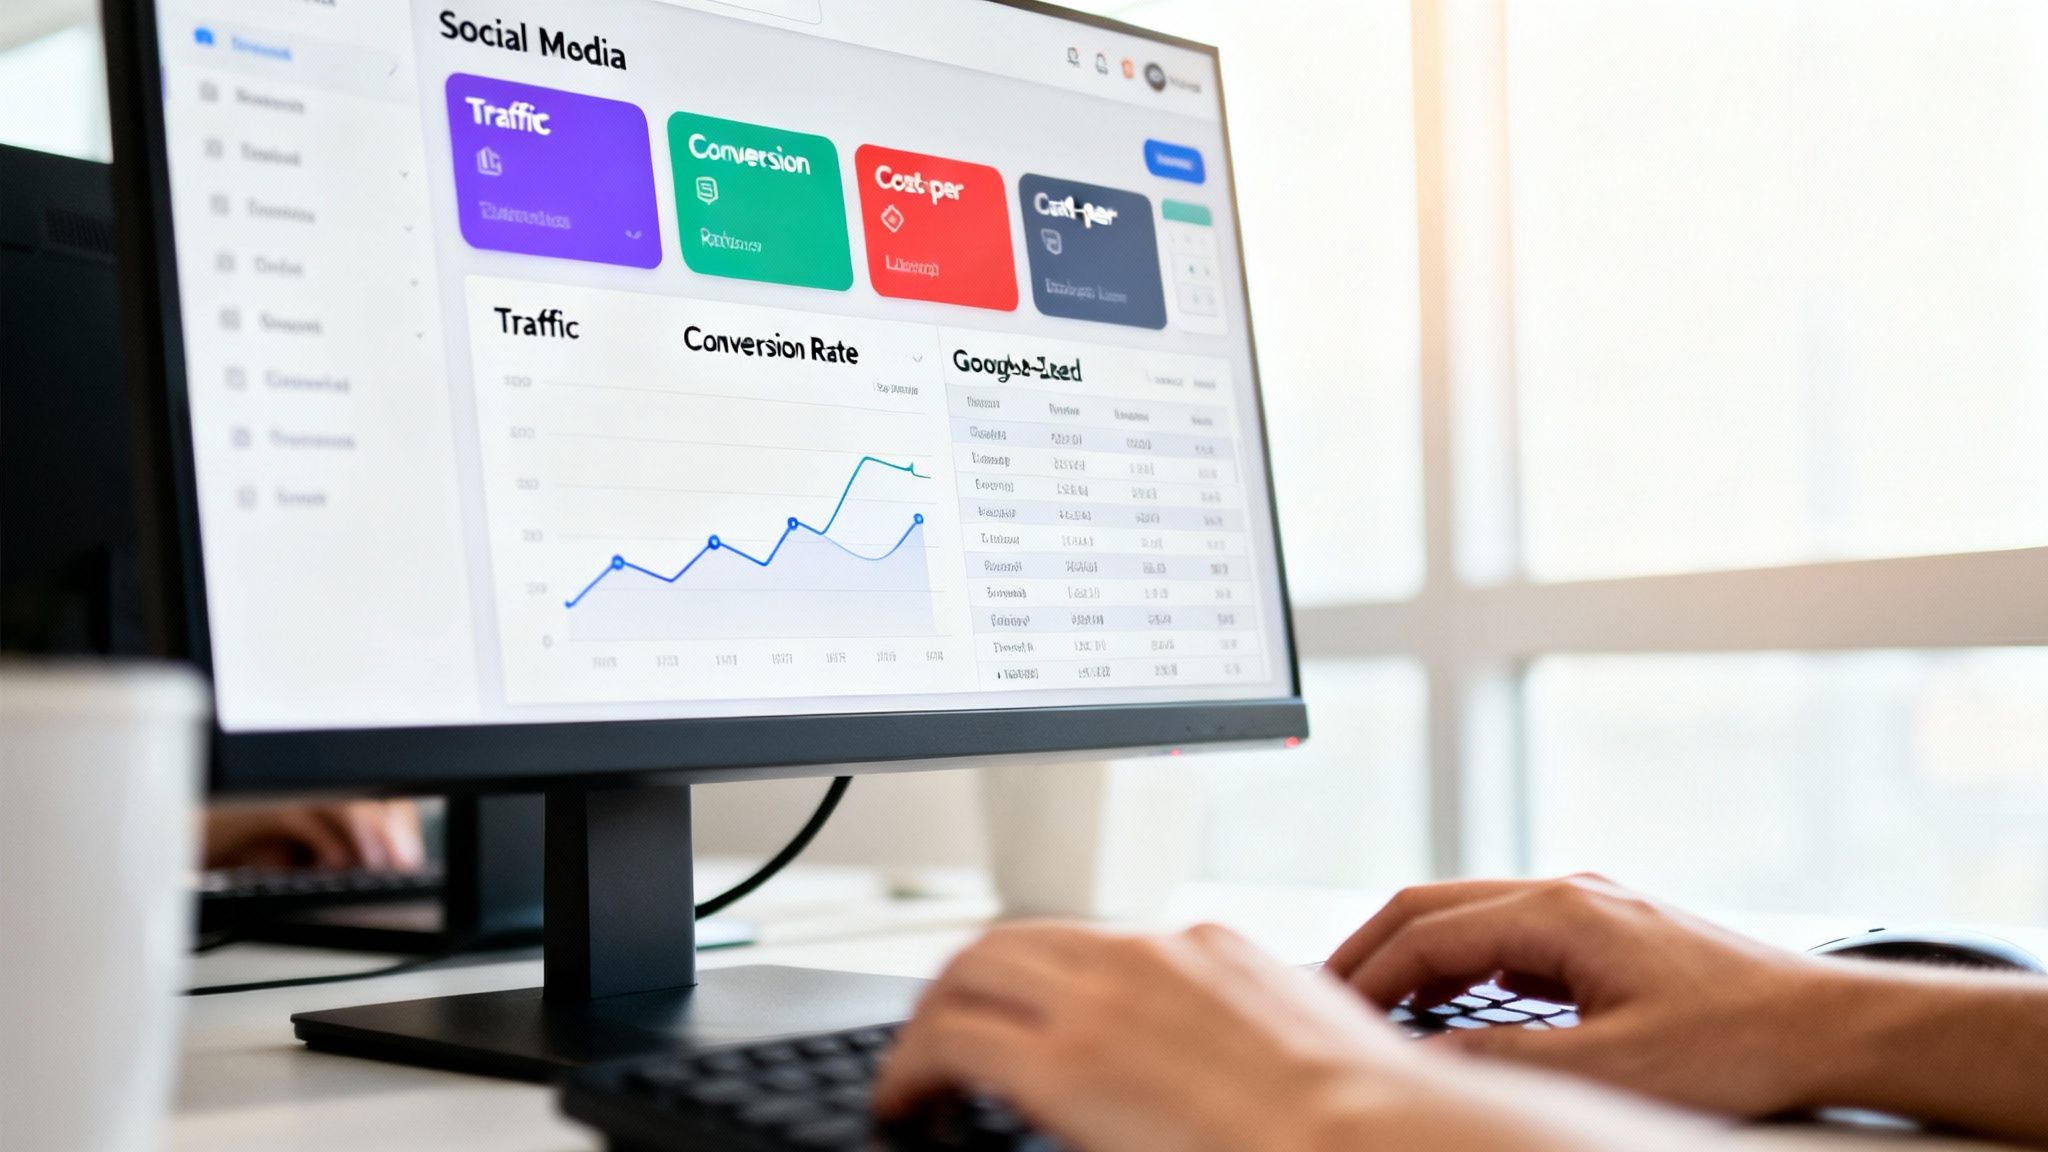
- Top-Line Summary: Put your most critical KPIs right at the top. For a lead gen dashboard, this could be "Total Leads from LinkedIn" and your current "Cost Per Lead." Make it impossible to miss.
- Trend Graphs: Use simple line charts to show performance over time. A month-over-month CTR graph, for instance, instantly shows momentum (or a lack thereof) and helps you spot patterns.
- Top Performers: Dedicate a small section to your top 3-5 posts for that period, ranked by your main KPI. If clicks are your goal, show the posts that drove the most traffic. This tells you exactly what to create more of.
A great dashboard doesn't just present data; it answers critical questions. It should immediately tell you what’s working, what isn't, and where your biggest opportunities are for the next month.
This approach stops reporting from being a tedious task and turns it into a genuine strategic asset. It gives you a clear view of your progress and lets you plan your next moves with confidence.
Right, you've got your objectives and you know which metrics matter. But all that data is useless if it just sits there collecting digital dust. The real magic happens when you turn measurement into a consistent habit.
This isn't about becoming a slave to your analytics dashboard, anxiously checking it every five minutes. That’s a fast track to burnout and reacting to meaningless blips. Instead, you need a smart, sustainable rhythm—a system that forces you to pause, reflect, and make strategic decisions based on what’s actually happening.
Find Your Reporting Cadence
A balanced approach is key. You want to stay on top of things without getting lost in the noise. I’ve found that breaking it down into three timeframes works best for freelancers, consultants, and startup founders who are already wearing too many hats.
The Weekly Pulse-Check: Think of this as a quick, 15-minute coffee break with your data. The goal here is to spot immediate trends, especially if you're running paid campaigns. Take a look at the engagement rate by reach on your latest posts and the Click-Through Rate (CTR) on any active ads. It’s about agility, not deep analysis.
The Monthly Deep-Dive: Block out an hour for this one. This is where you zoom out a bit and see how you’re tracking against your bigger KPIs. Are you hitting that lead generation target? Is your follower growth moving in the right direction? This is your chance to connect the dots between your weekly activities and monthly goals.
The Quarterly Strategy Huddle: This is the big-picture meeting, even if it’s just with yourself. Here, you’re evaluating the overall strategy and its impact on major business goals like ROI. This is when you ask the tough questions: "What's delivering real value?" and "Where should we double down for the next three months?"
By setting up this rhythm, you’re creating a powerful feedback loop. The insights from one week inform your tactics for the next, and what you learn in a month helps shape your strategy for the entire next quarter.
This structured cadence stops measurement from being a dreaded, once-in-a-while task. It turns it into an ongoing, strategic conversation that constantly answers the most important questions: What's working? What isn’t? And what are we going to do about it?
Got Questions? Let's Talk Specifics
Even with the best game plan, you're bound to hit a few snags when you start digging into social media analytics. That’s perfectly normal. Turning a high-level strategy into something you can actually do every day is where the real work happens.
Here are a few common sticking points I see all the time.
What’s the Real Difference Between a Metric and a KPI?
This one trips people up constantly, but getting it right is key to not drowning in data.
Think of it like this: a metric is just a number. It's a data point. Follower count, likes, website clicks—all metrics. A Key Performance Indicator (KPI), on the other hand, is a metric you’ve personally chosen because it tells you if you're getting closer to a critical business goal.
For example, 'likes' is a metric. It's nice to have, but it doesn't pay the bills. But if your main goal is to get leads for a new service, then the 'click-through rate on posts promoting your webinar sign-up page' is a KPI. It’s a metric with a mission.
All KPIs are metrics, but only the most important, goal-oriented metrics earn the title of KPI.
How Often Should I Actually Be Checking This Stuff?
It's tempting to watch your numbers like a hawk, but reacting to every tiny dip and spike is a fast track to burnout. You need a rhythm that keeps you informed without driving you crazy.
Here’s a cadence that works for most freelancers and small businesses:
- Weekly Check-ins: This is perfect for keeping an eye on active campaigns. Are your latest ads hitting the mark? How's that new content series performing? A quick weekly glance is all you need.
- Monthly Reports: This is where you zoom out a bit. Look at the bigger trends in your reach, overall engagement, and follower growth. This is about direction, not daily details.
- Quarterly Reviews: Time to get strategic. This is when you pull back and see how you’re tracking against the big business goals you set. It’s your chance to ask, "Is our strategy still working?" and make changes if it’s not.
What Are the Best Tools for Measuring Social Media Success?
You don't need to spend a fortune to get good data. Honestly, for most people starting out, the free, built-in analytics tools are more than enough.
Meta Business Suite and LinkedIn Analytics are surprisingly robust and give you a ton of information right out of the box.
When you're ready to level up, dedicated tools like Sprout Social or Hootsuite can pull all your data into one place, which is a huge time-saver. And if you love building custom reports, Google's Looker Studio is a fantastic free option for creating dashboards that show you exactly what you need to see.
For a deeper dive into LinkedIn specifically, you can learn more about how to measure success on LinkedIn in our dedicated guide.
Feeling like this is a lot to handle on top of creating all that content? PostFlow was built for this exact problem. Our AI content strategist, Emilia, helps you turn your ideas into a steady flow of great LinkedIn posts and even gives you the performance analytics to see what's resonating.