Databox Review

Table of Contents
What is Databox?
Databox is a no-code business intelligence and analytics platform that helps teams centralize data from 130+ tools into interactive dashboards and automated reports. It is designed for growing businesses, agencies, and teams that need quick answers from their data without investing in complex, legacy BI infrastructure. The platform emphasizes ease of use, with drag-and-drop dashboard building, pre-built templates, and a no-code metric builder.
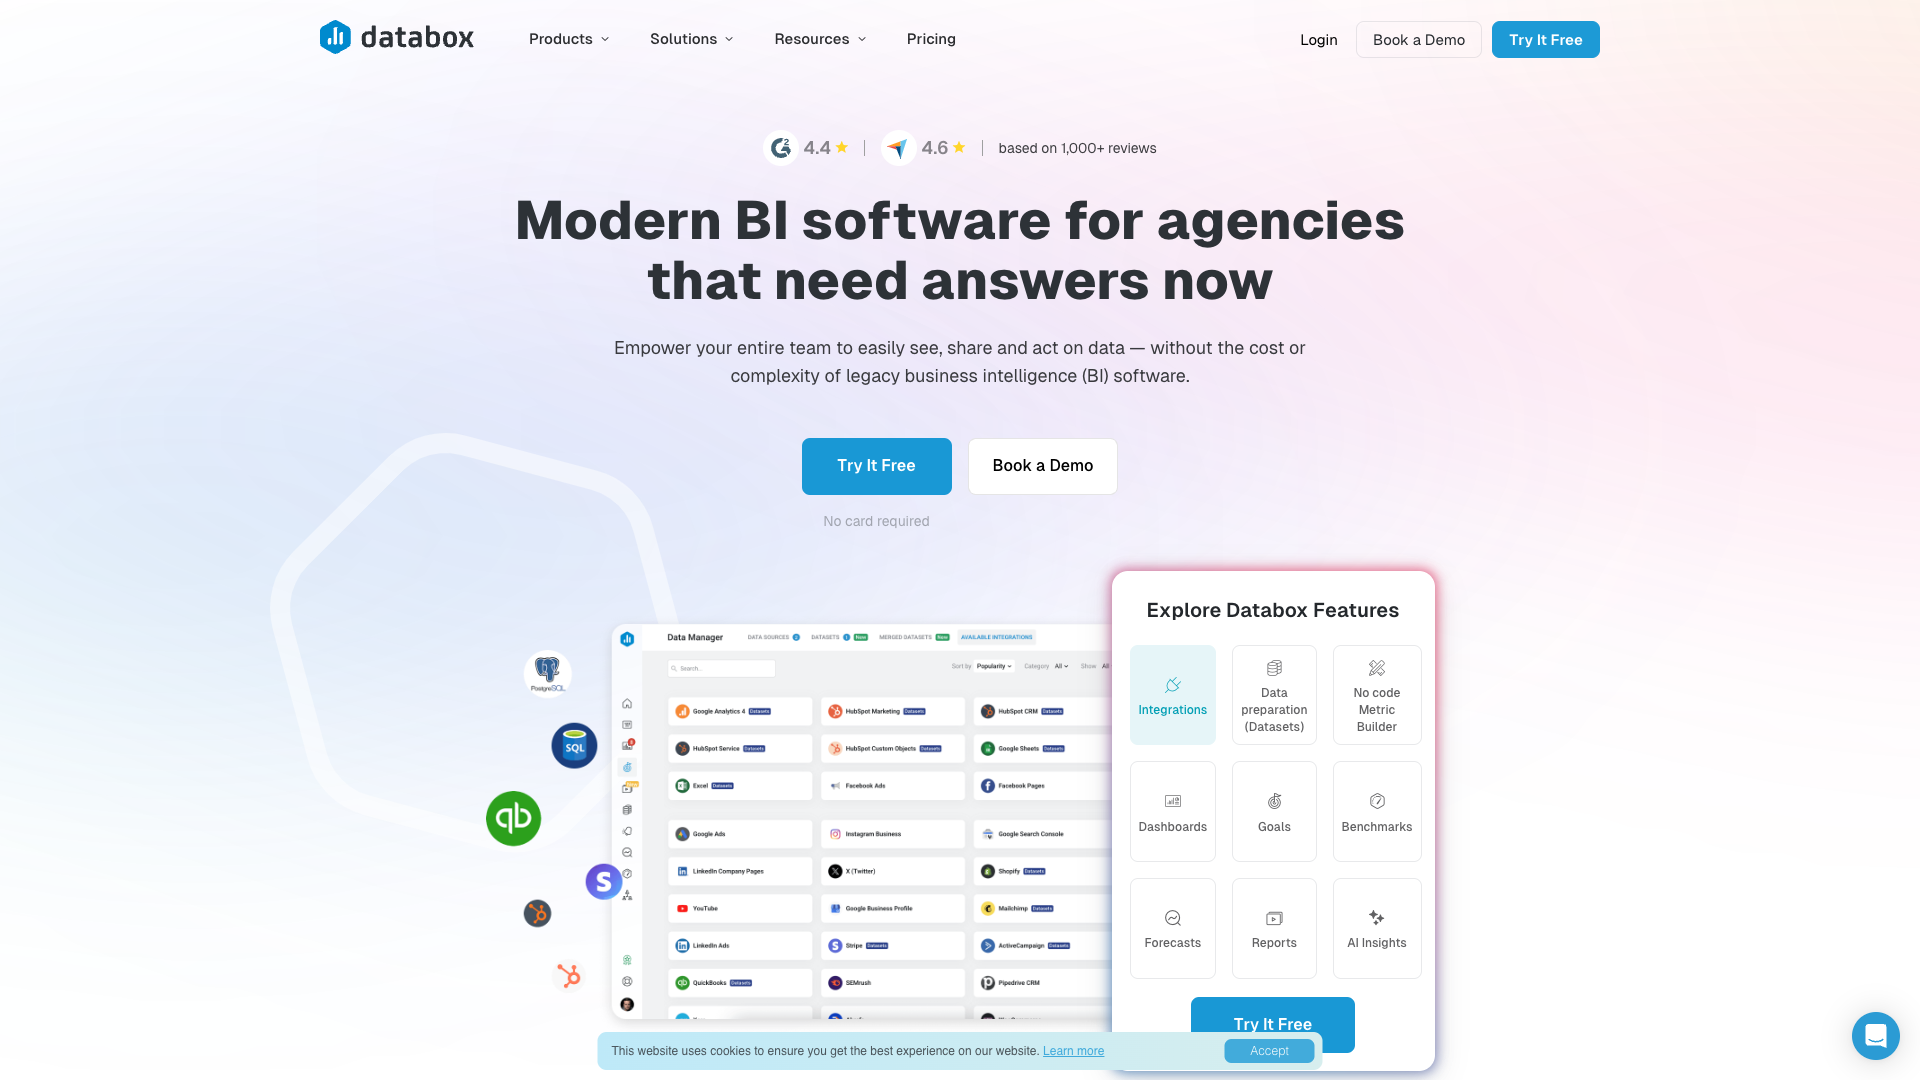
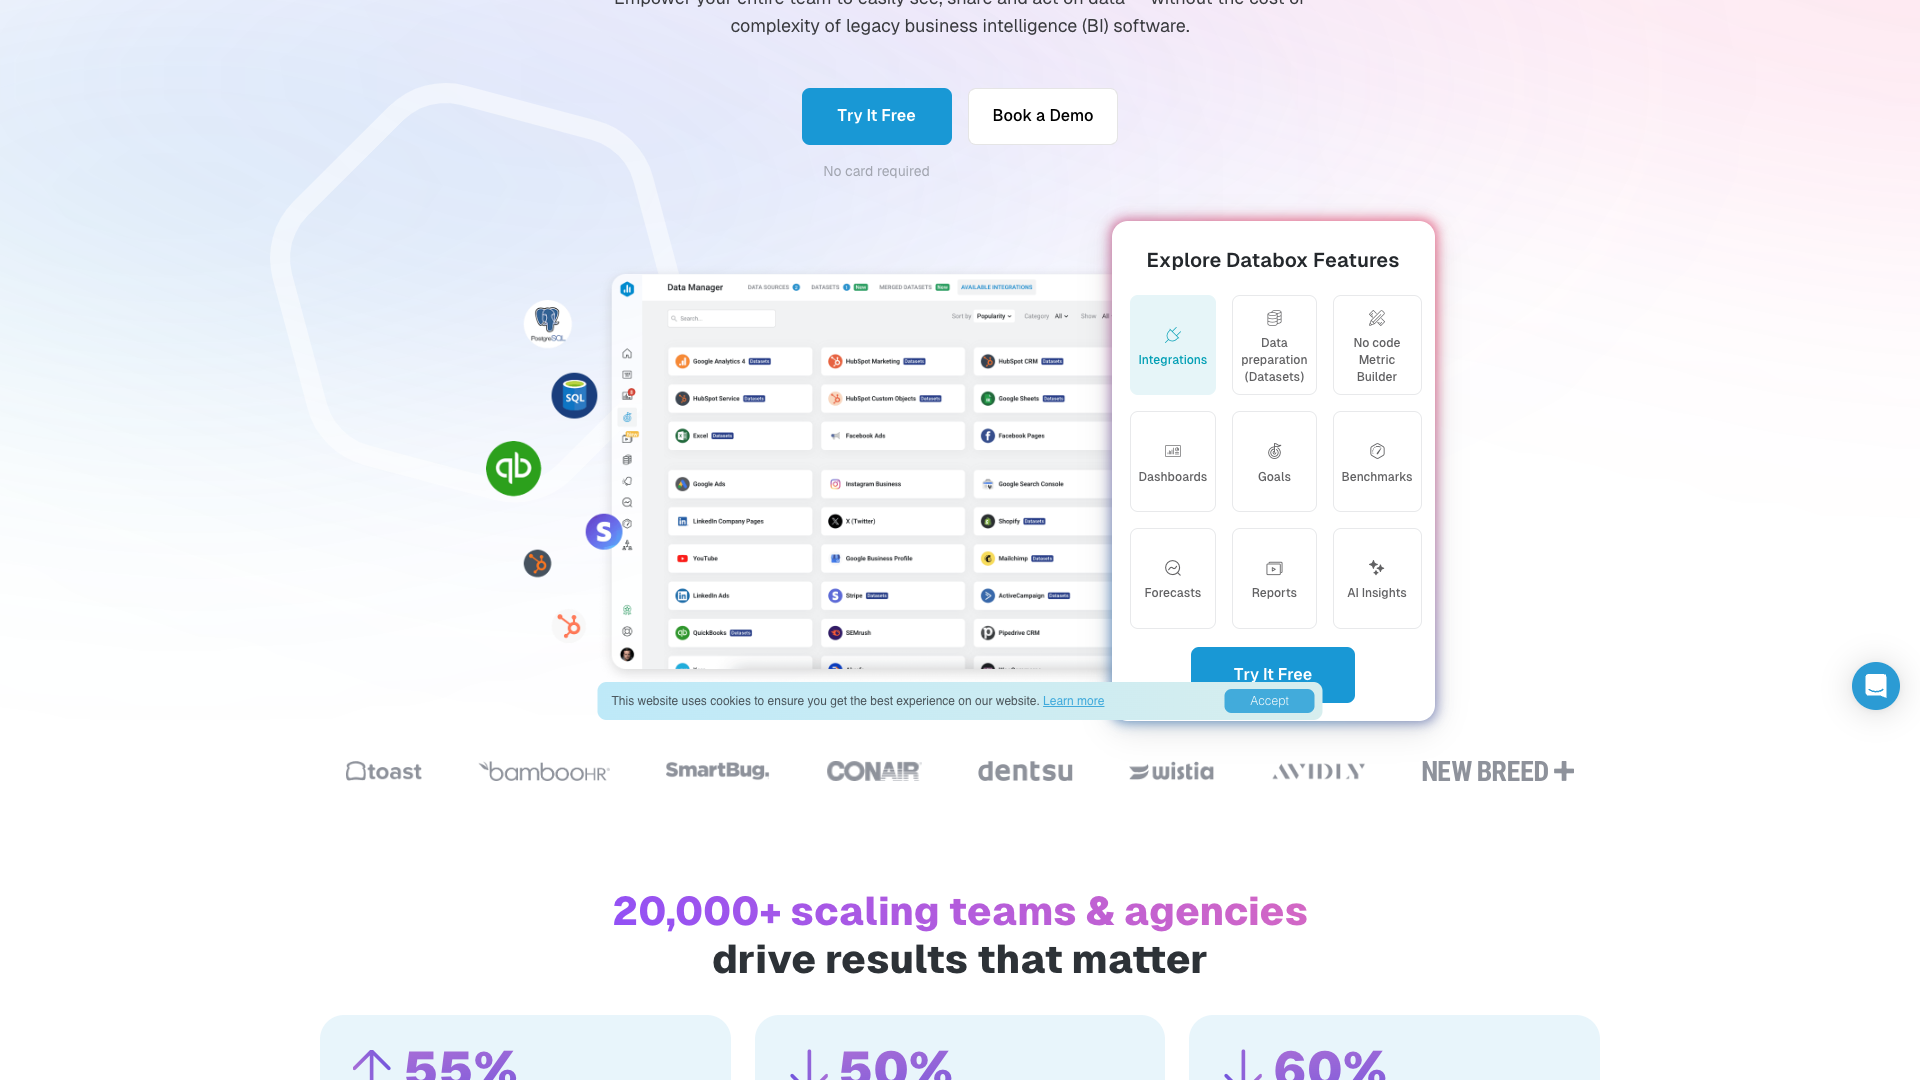
On the homepage, Databox describes itself as "modern BI software for teams and agencies that need answers now." Every plan includes unlimited users, which makes it attractive for organizations that want to democratize access to performance metrics. The product is built around a clear workflow: connect data sources, prepare data, visualize it, analyze trends, automate reporting, and plan using goals and forecasts.
Databox also highlights its role in enabling "DIY BI," where non-technical team members can self-serve insights instead of waiting on analysts or IT. This is reinforced by features like AI-powered summaries, real-time dashboards, and automated performance notifications. The company positions Databox as a way to remove bottlenecks, reduce reporting costs, and keep leaders informed with timely, consistent data.
From a market positioning standpoint, Databox competes with tools like Tableau, Power BI, Looker Studio, AgencyAnalytics, Klipfolio, Supermetrics, Geckoboard, Whatagraph, Qlik, and DashThis. On its site, Databox explicitly compares itself to these platforms, emphasizing lower complexity, faster setup, and more flexible pricing. It is particularly strong in agency use cases, where managing multiple client accounts and standardizing reporting workflows is critical.
Core Value Proposition: BI Without the Baggage
Databox’s core value proposition is "business intelligence, without the baggage", meaning it aims to deliver BI capabilities without the steep learning curve, high per-seat licensing, and heavy IT involvement typical of legacy tools. The platform removes per-user pricing by offering unlimited users on every plan, which encourages broader adoption across teams. This is especially valuable for organizations that want executives, managers, and contributors all looking at the same live metrics.
The product is built around a self-service, no-code workflow where users can connect data sources, build dashboards, and create custom metrics without writing SQL or code. Databox provides 130+ one-click integrations, 200+ dashboard templates, and a no-code metric builder to help teams get value quickly. For more advanced users, datasets and database/warehouse connections allow deeper analysis without forcing everyone into complex query tools.
Databox also focuses heavily on speed to insight. Real-time dashboards, AI-powered performance summaries, and automated alerts are designed to help teams spot trends and anomalies faster. Instead of waiting days for analysts to build ad-hoc reports, stakeholders can drill into metrics, compare periods, and filter by dimensions directly in the interface. This makes Databox particularly compelling for fast-moving SaaS, ecommerce, and agency environments.
Another key part of the value proposition is alignment and collaboration. Features like goals, benchmarks, and spaces help teams organize metrics by department, client, or initiative. The platform’s emphasis on sharing—through TV dashboards, shareable links, and scheduled reports—supports a culture where performance data is visible and actionable across the organization.


Key Features and Capabilities
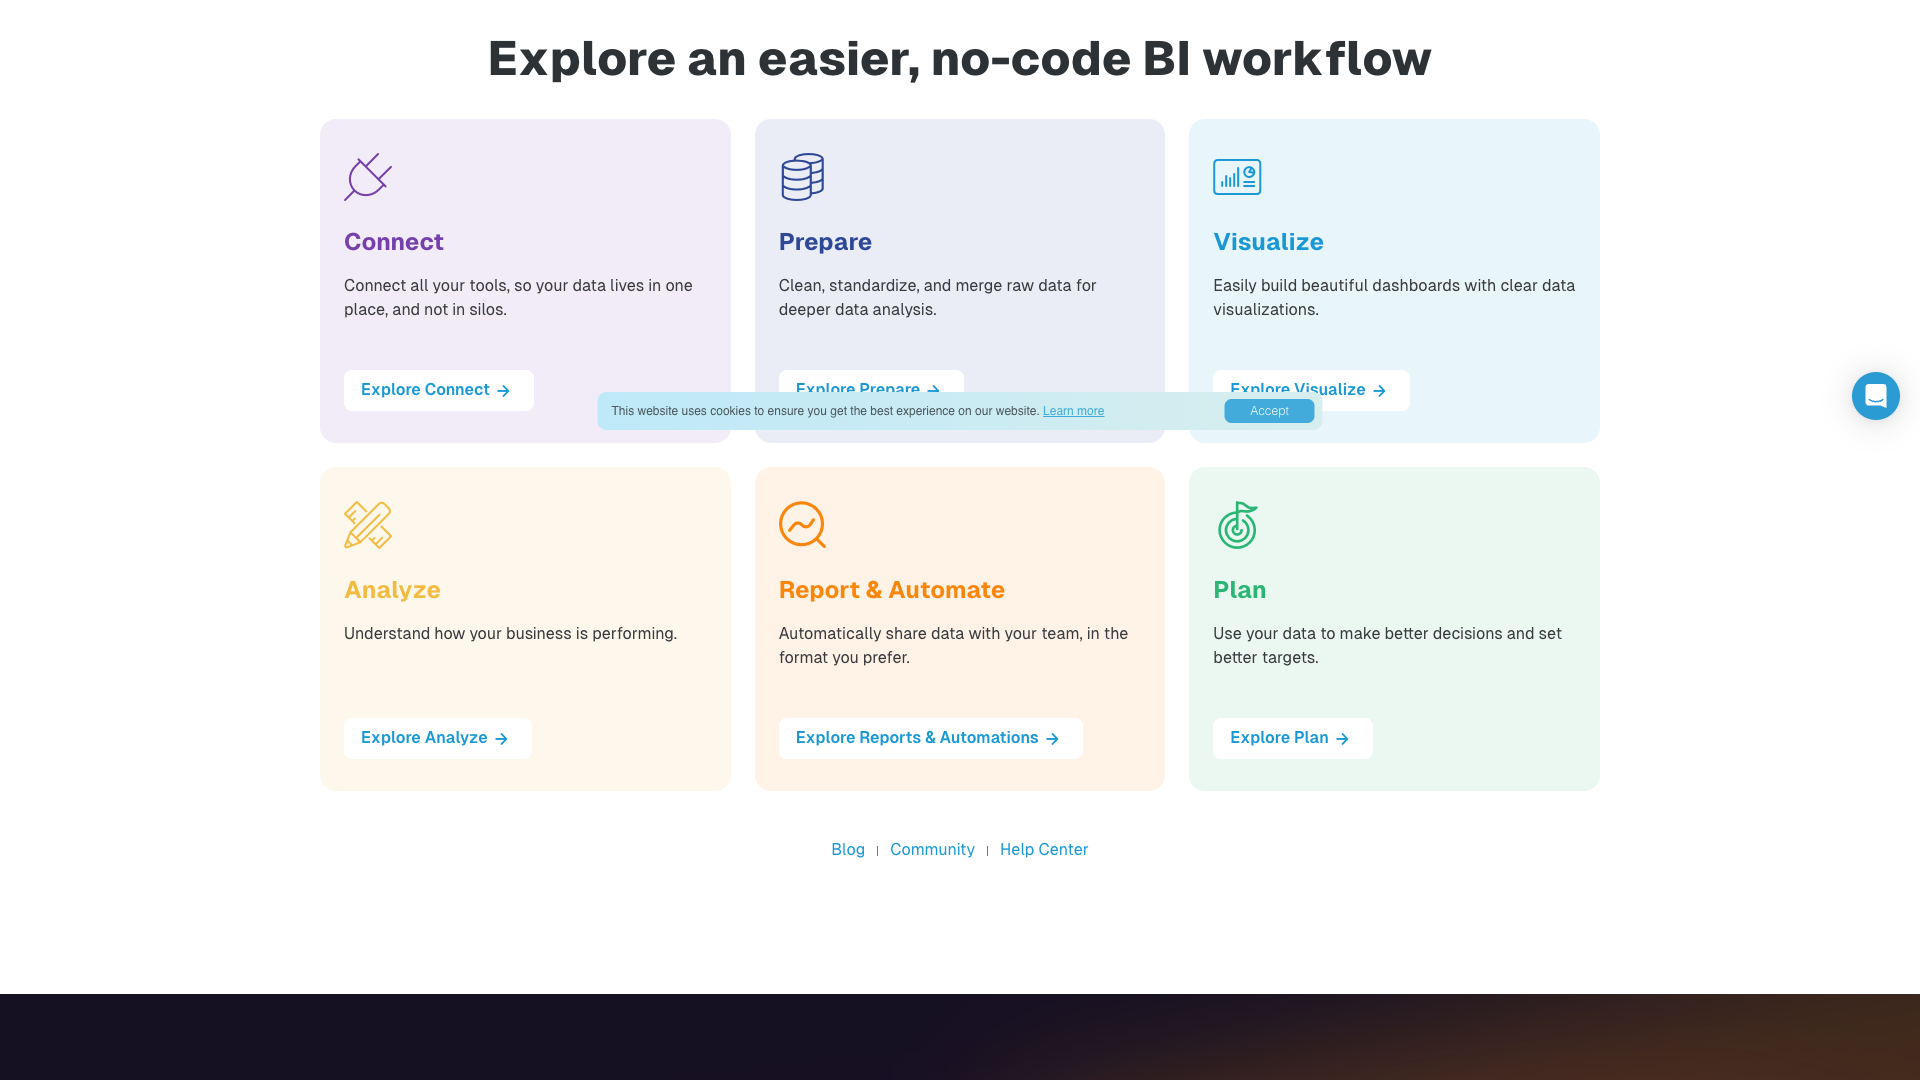
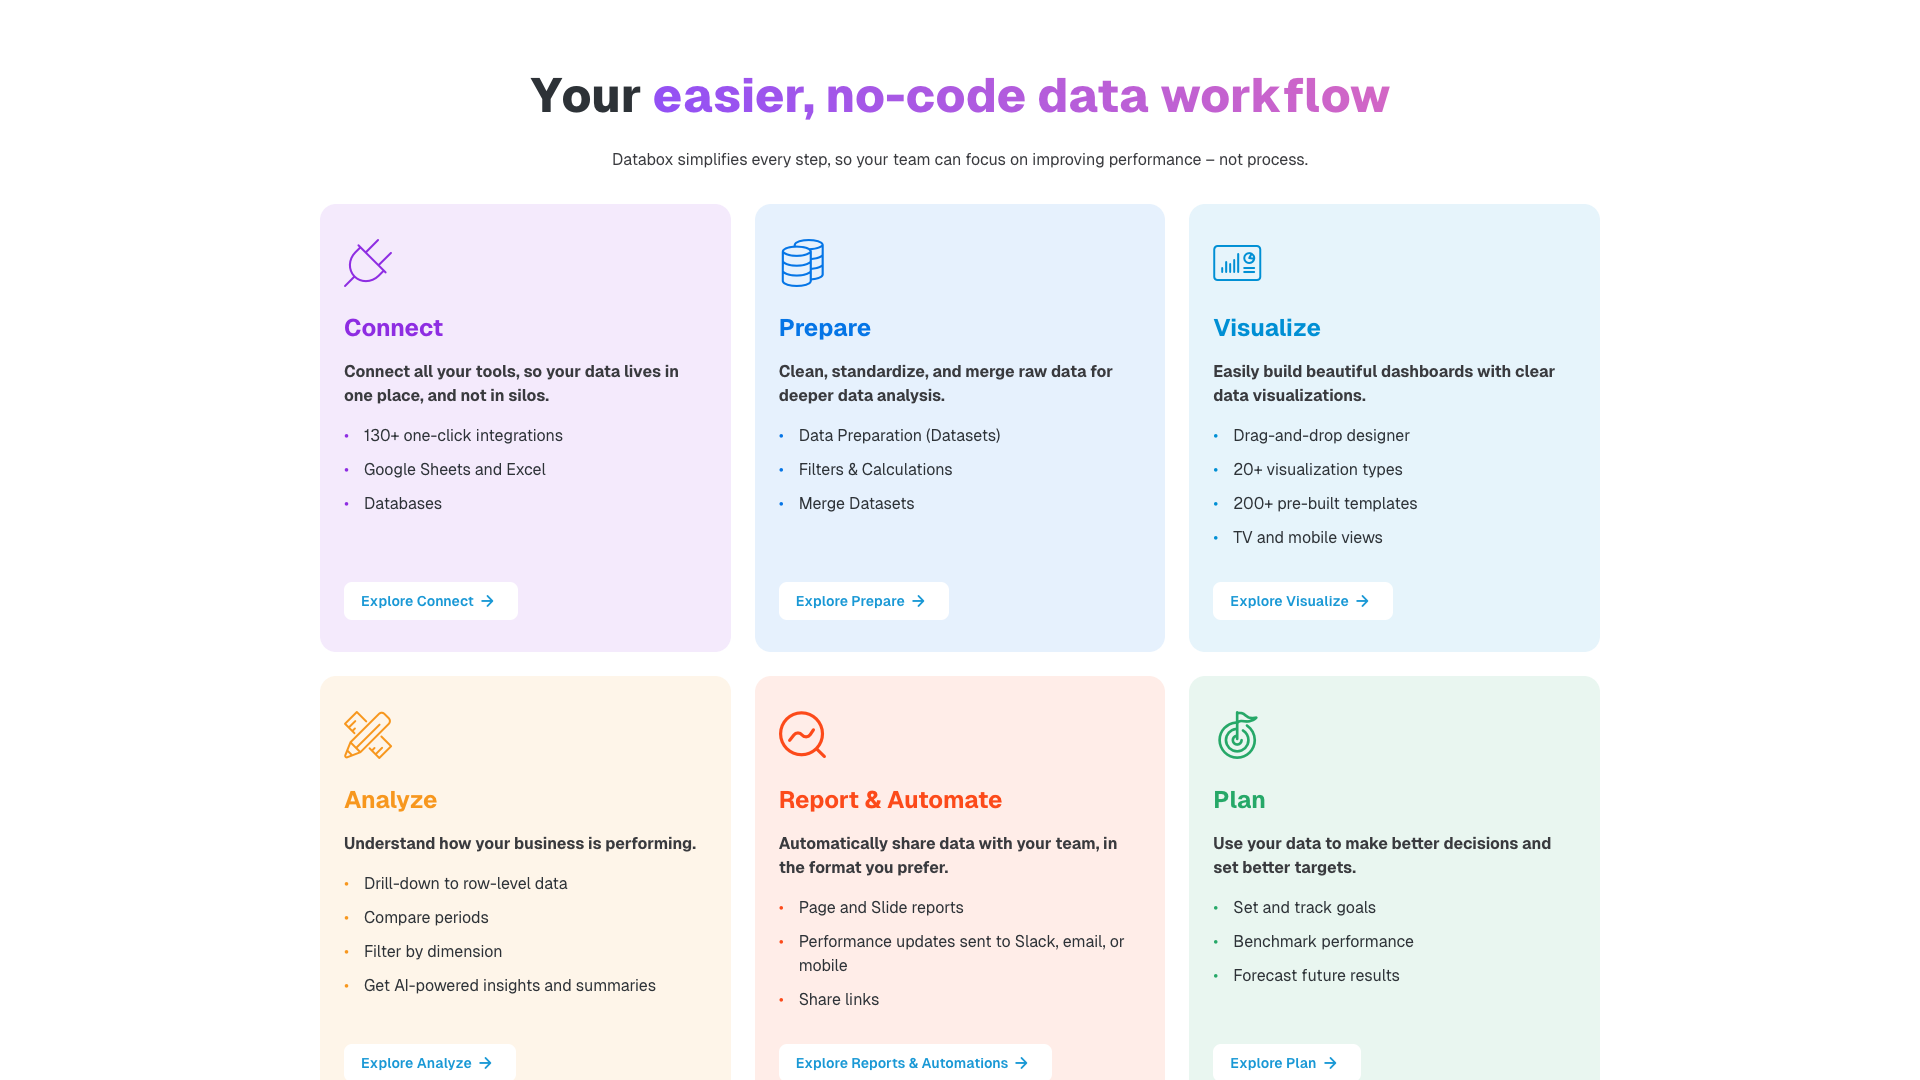
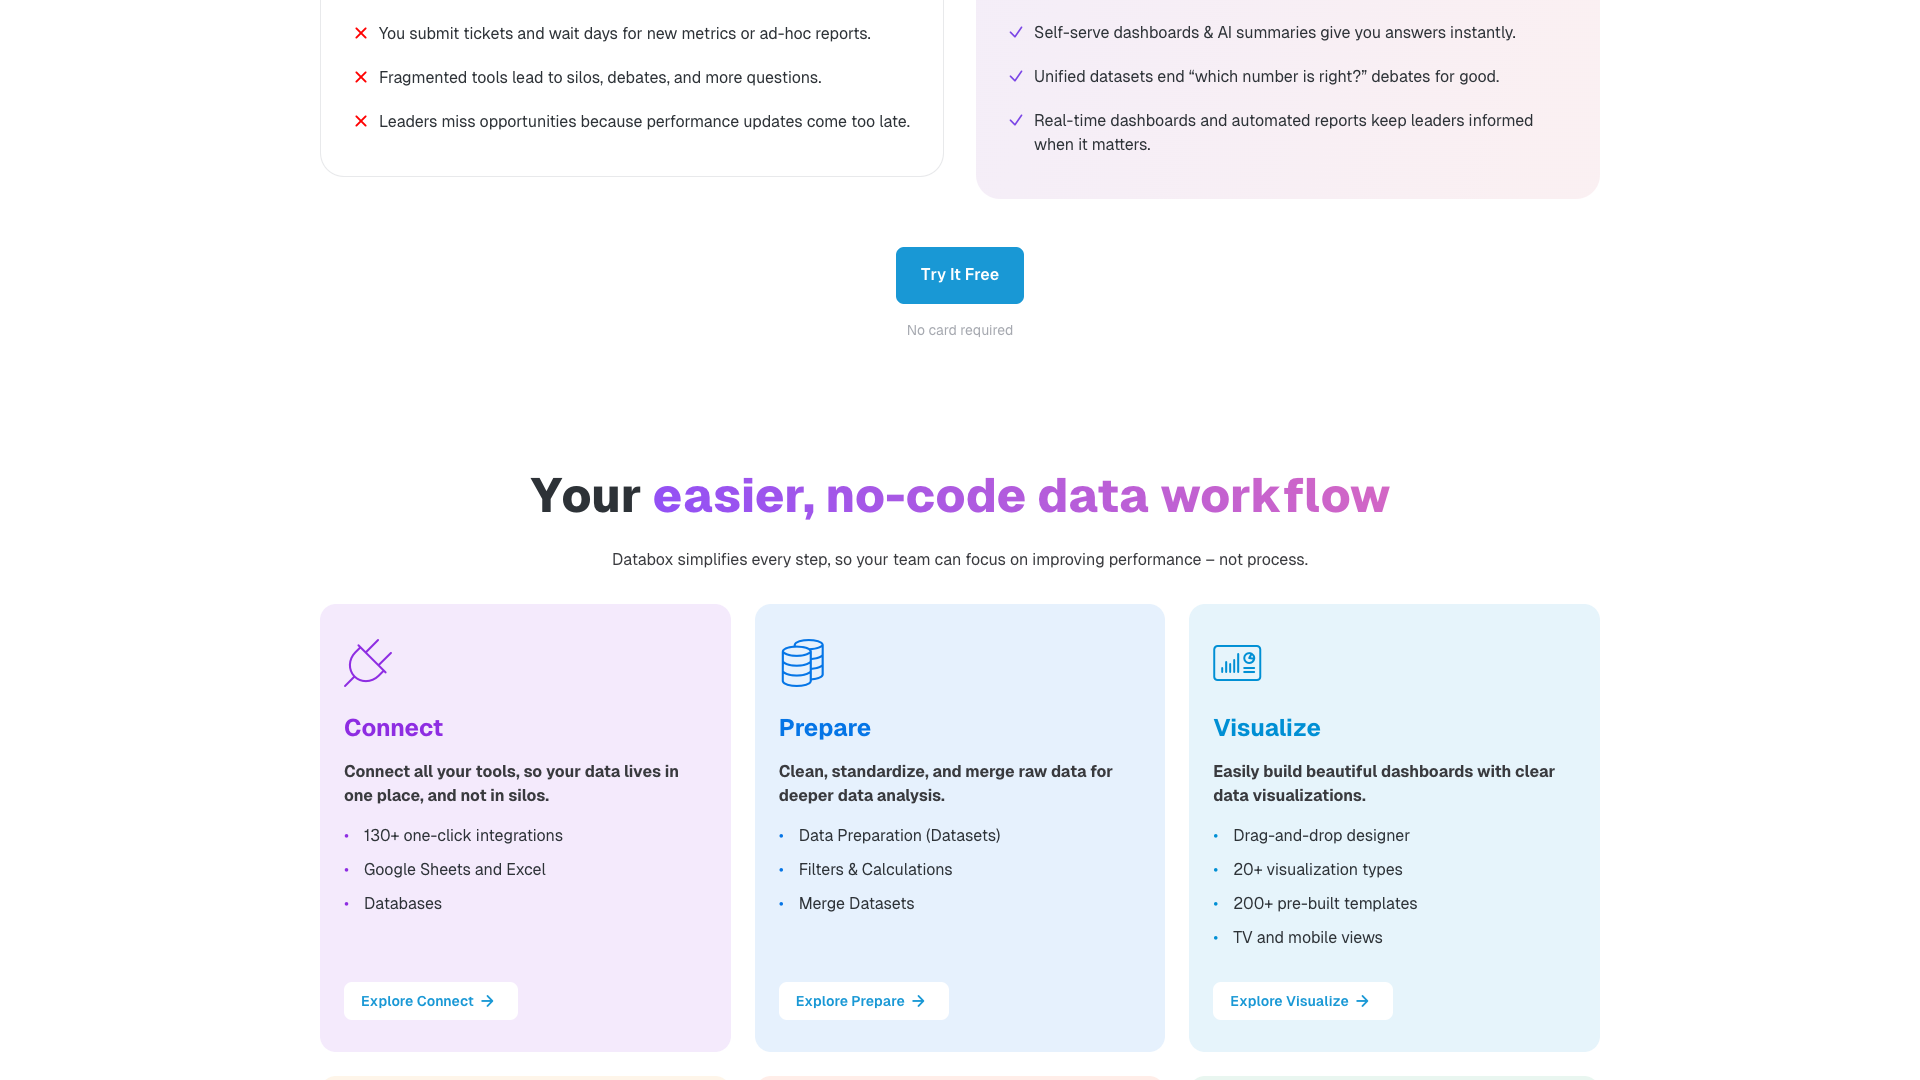
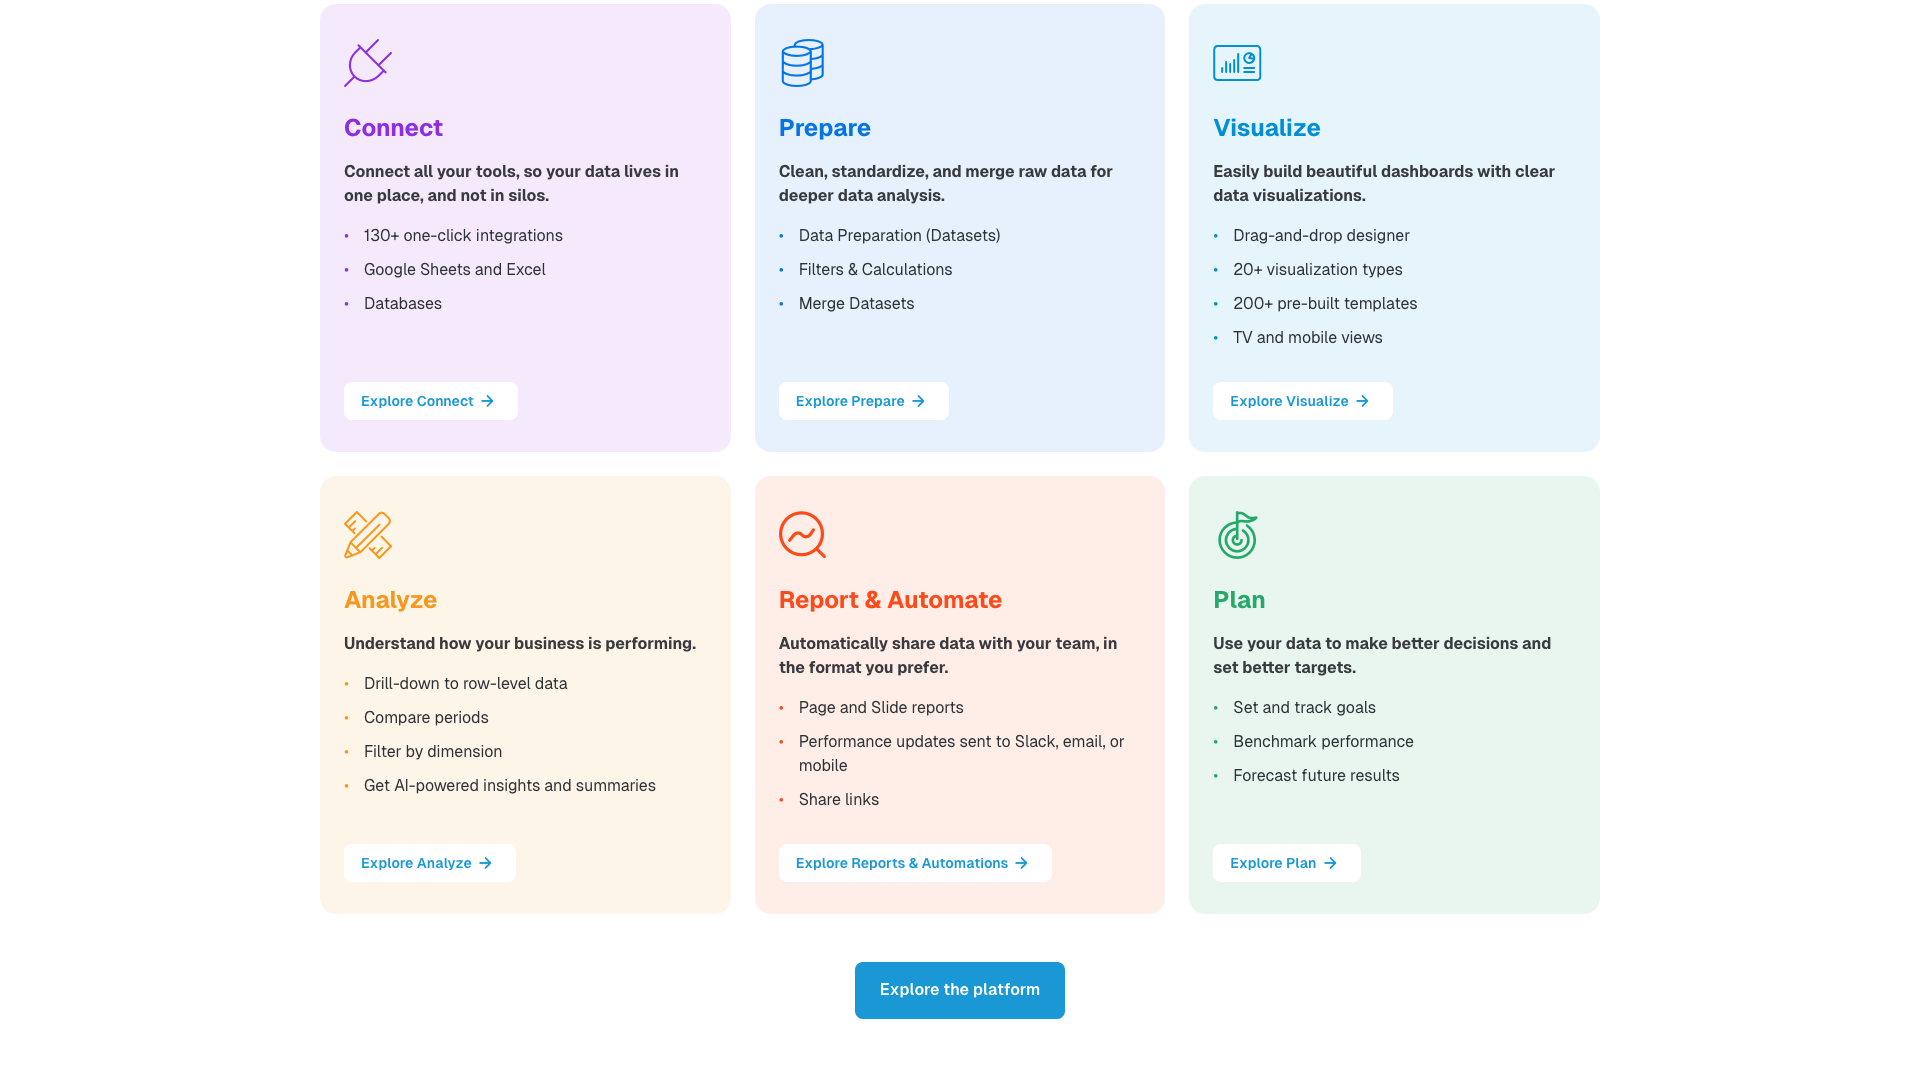
Databox organizes its capabilities around a clear data journey: Connect, Prepare, Visualize, Analyze, Report & Automate, and Plan. In the Connect stage, users can integrate data from 130+ cloud tools such as HubSpot, Google Analytics 4, Google Ads, Facebook Ads, LinkedIn Ads, Shopify, QuickBooks, Stripe, Intercom, and many others. The platform also supports Google Sheets, Excel, APIs, SDKs, and automation platforms like Zapier and Make for custom or long-tail data sources.
In the Prepare stage, Databox offers Datasets for cleaning, standardizing, and merging raw data from one or more sources. Users can apply filters, create calculated columns, and merge datasets to build more flexible reporting models. Dataset integrations unlock additional properties and segments beyond standard connectors, and advanced users can connect databases and cloud warehouses without writing SQL. This makes Databox suitable for both simple marketing dashboards and more complex multi-source analyses.
For visualization, Databox provides a drag-and-drop dashboard designer with 20+ visualization types and more than 200 pre-built templates. Users can create unlimited dashboards, stream them to TVs, embed them in other tools, and use custom account templates to standardize layouts across clients or teams. Single-dimension filtering, row-level drilldowns (with datasets), and media creative previews help teams explore data in more depth while keeping dashboards accessible.
The Analyze and Report & Automate stages are powered by AI summaries, smart alerts, and automated reports. AI-generated performance summaries explain trends and suggest next steps, while smart alerts notify users of unusual spikes or dips in key metrics. Reports can be delivered as pages or slide decks, shared via email, Slack, or mobile, and archived for historical reference. In the Plan stage, Databox supports goals, forecasts, and performance management features like OKRs, helping teams connect day-to-day metrics with longer-term targets.
- 130+ one-click integrations with popular marketing, sales, finance, and support tools
- No-code metric builder for creating custom and calculated metrics
- Datasets for cleaning, merging, and structuring raw data from multiple sources
- Drag-and-drop dashboard designer with 20+ visualization types and 200+ templates
- Unlimited users on every plan with granular permissions and spaces
- AI-powered performance summaries and smart alerts for anomaly detection
- Automated reports via email, Slack, and mobile with page and slide formats
- Goals, benchmarks, forecasts, and OKRs for performance management and planning
- Support for Google Sheets, Excel, APIs, SDKs, Zapier, and Make for custom data
- Database and cloud warehouse connections without requiring SQL for metric creation
Pricing and Plans
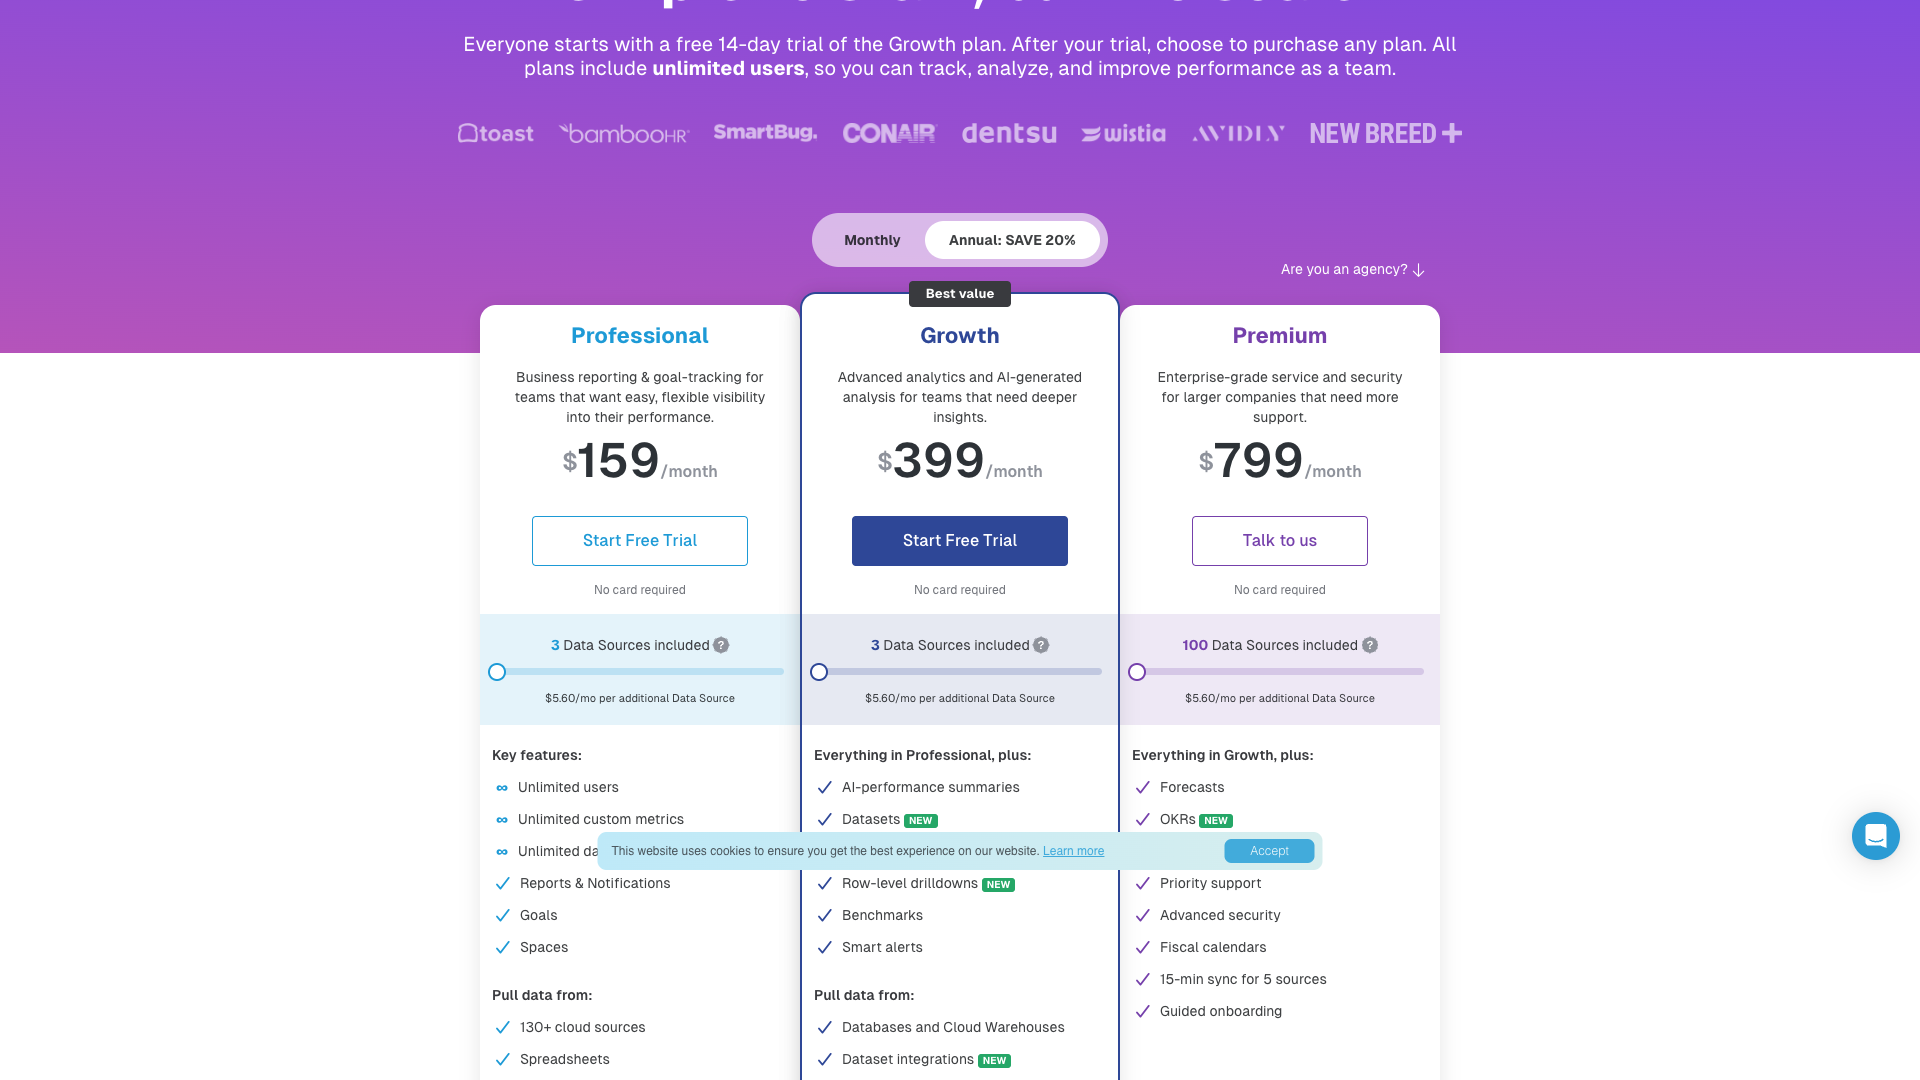
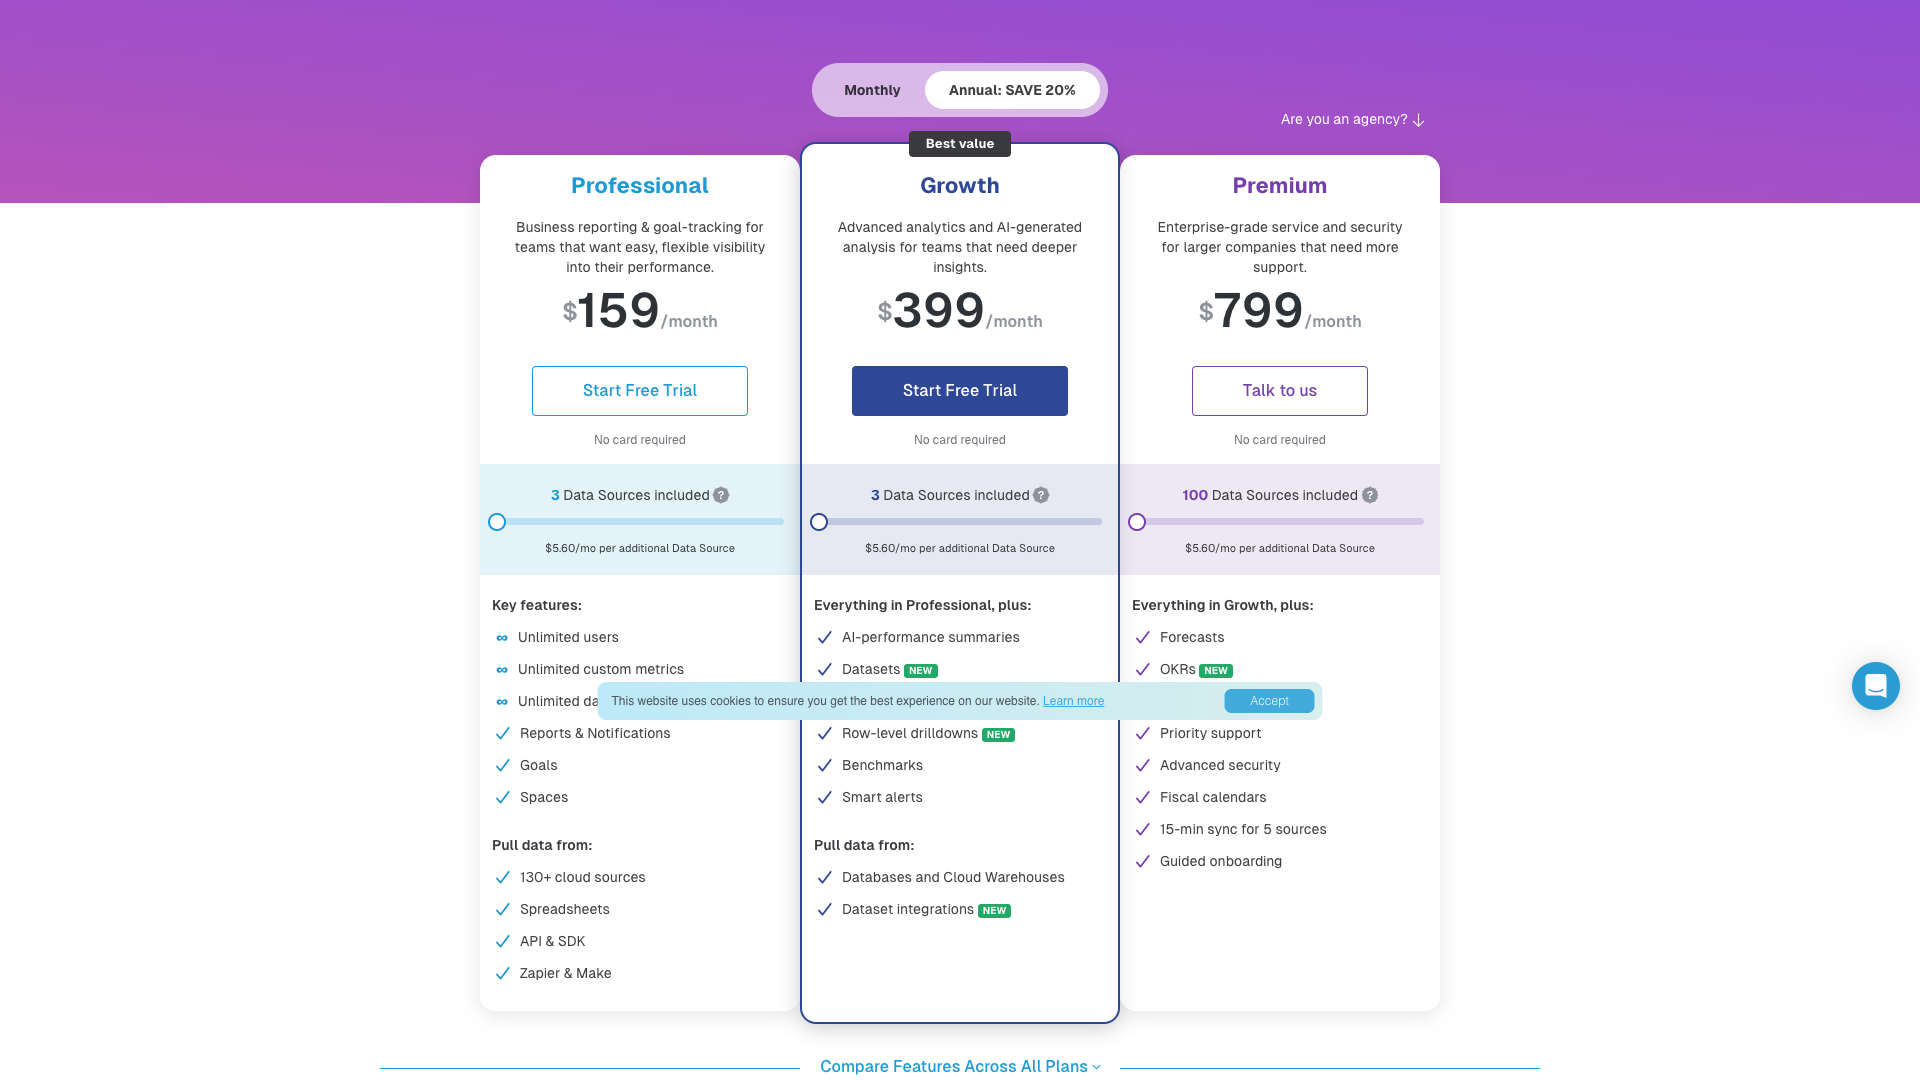
Databox’s pricing page presents a simple, scalable structure with a free 14-day trial of the Growth plan and unlimited users on every tier. Pricing is primarily driven by the number and type of data sources, with three core paid plans: Professional, Growth, and Enterprise. All plans include three data sources by default, with additional sources billed separately.
The Professional plan is positioned as business reporting and goal-tracking for teams that want flexible visibility into performance. It includes unlimited users, unlimited custom metrics, unlimited dashboards, reports and notifications, goals, spaces, and connections to 130+ cloud sources, spreadsheets, API/SDK, and Zapier/Make. The Growth plan adds advanced analytics capabilities like AI performance summaries, datasets, advanced filtering, row-level drilldowns, benchmarks, smart alerts, and database/warehouse connections.
For larger organizations, the Enterprise plan (details typically provided via sales) is designed for complex data environments and higher governance needs. While the public page emphasizes add-ons like advanced security management, priority support, guided onboarding, and dedicated analyst time, exact Enterprise pricing is usually custom. Agencies can also benefit from features such as unlimited client accounts, client performance overviews, custom account templates, and white-label options.
Databox offers both monthly and annual billing, with annual plans advertised as saving 20% compared to monthly. Every plan starts with a free 14-day trial of the Growth plan, and no credit card is required to get started. This makes it easy to test the platform’s capabilities, especially for teams evaluating multiple BI tools at once.
Professional
- 3 data sources included by default
- Unlimited users on the account
- Unlimited custom and calculated metrics
- Unlimited dashboards for teams or clients
- Reports and performance notifications
- Goal setting and real-time goal tracking
- Spaces to group metrics, dashboards, and reports
- 130+ cloud integrations (e.g., HubSpot, GA4, Facebook Ads)
- Spreadsheet connections via Google Sheets and Excel
- API and SDK access for custom data
- Zapier and Make integrations for 2,000+ apps
- 24 months of historical data
- 20GB warehouse data storage
- TV and mobile dashboard views
- Pre-built dashboard templates and custom account templates
- On-demand data refresh and single-dimension filtering
- Basic account management and user permissions
Price shown for monthly billing; annual plans are advertised with approximately 20% savings. Additional data sources are billed at approximately $5.60/month each.
Growth
- Everything in Professional plan
- 3 data sources included by default
- AI performance summaries explaining trends and suggesting next steps
- Datasets for preparing custom tables of raw data
- Advanced filtering on dashboards by dimension
- Row-level drilldowns for dataset-based metrics
- Benchmarks to compare metrics against similar companies
- Smart alerts for unusual spikes or dips in performance
- Database and cloud warehouse connections without SQL
- Dataset integrations with expanded properties and segments
- Unlimited historical data for dataset-supported integrations
- 20GB or more of warehouse data storage (depending on usage)
- Enhanced analysis capabilities for multi-source reporting
Price shown for monthly billing; annual billing offers around 20% savings. Additional data sources are billed at approximately $5.60/month each.
All plans include unlimited users and start with a free 14-day trial of the Growth plan with no credit card required. Pricing details and add-on availability may change over time; always confirm on the official pricing page.

Customer Feedback and Social Proof
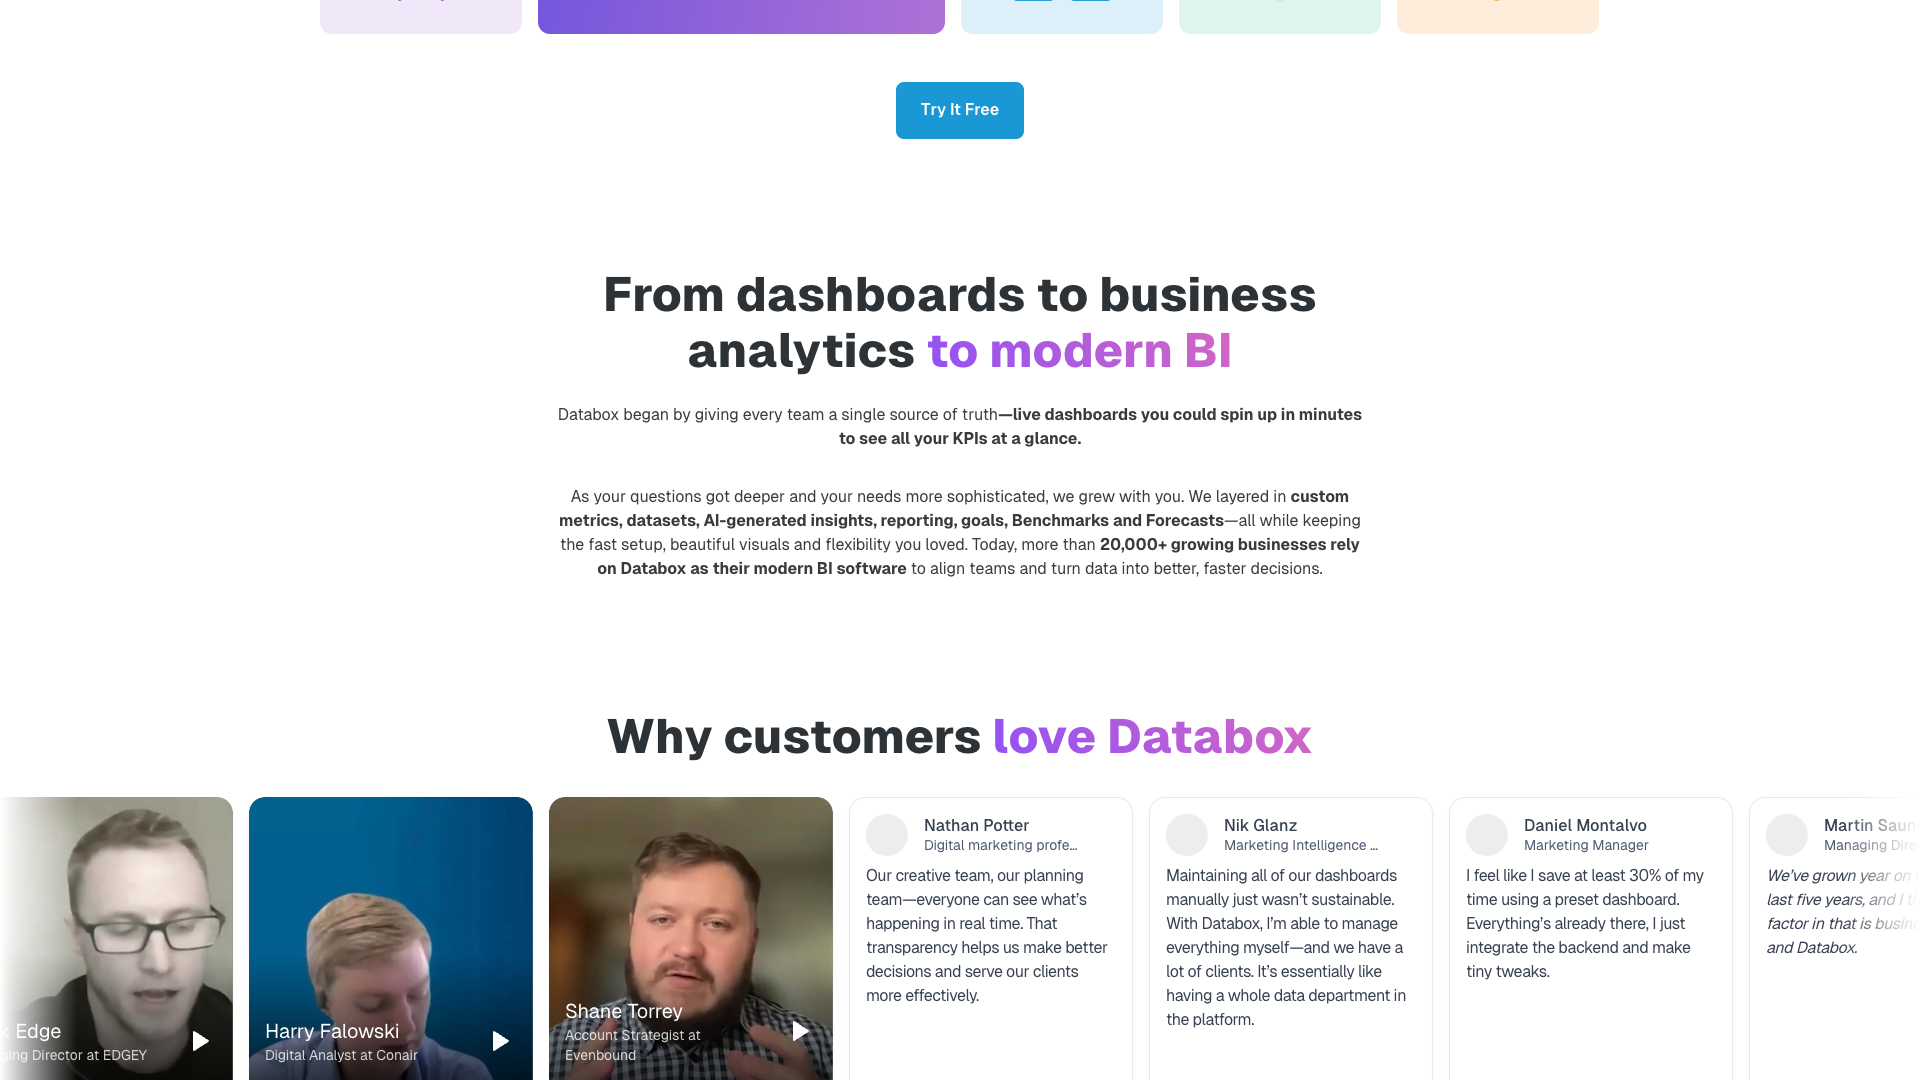
Databox prominently showcases customer stories and testimonials to demonstrate real-world impact. Case studies like Evenbound, DispatchTrack, and Conair highlight improvements such as a 55% increase in sales year-over-year, a 50% decrease in reporting costs, and a 60% reduction in time spent creating reports. These stories emphasize how automated reporting and centralized dashboards free teams to focus on strategy and execution.
On the homepage, Databox references strong review scores, including ratings such as 4.4 and 4.6 based on 1,000+ reviews across platforms like G2 and Capterra. While detailed third-party reviews live off-site, Databox summarizes common themes: easier access to metrics, better alignment across teams, and more productive, data-driven meetings. Customers frequently mention that Databox becomes a must-have part of their tech stack for tracking the metrics that matter.
Testimonials on the site emphasize alignment, clarity, and self-service. One quote notes that Databox helps teams stay aligned by sharing up-to-date performance metrics daily, making meetings more productive and data-driven. Another highlights that Databox allows users to connect different data sources to gain context across KPIs, bringing clarity by seeing data in one place.
Other feedback focuses on empowering non-technical users and reducing confusion about which numbers are correct. Customers describe how Databox enables team members from different departments to explore data without waiting on technical staff, and how unified datasets end debates over which version of the data is right. Overall sentiment is that Databox makes data more digestible, accessible, and actionable for a wide range of stakeholders.
- It was said that Databox helped the team stay aligned by sharing up-to-date performance metrics daily, which made meetings more productive and data-driven. – Sarah M., Marketing Director
- It was described that Databox became an absolute must in the tech stack, enabling tracking of metrics that mattered in ways other reporting tools did not. – James R., Agency Owner
- It was noted that connecting different data sources in Databox provided better context across KPIs and brought clarity by seeing data in one place. – Priya K., Head of Growth
- It was shared that Databox empowered team members from different departments to explore data without waiting on someone technical. – Daniel L., Operations Manager
- It was mentioned that combining all key metrics into a single Databox location removed worries about which version of the data was right. – Emily S., VP of Revenue


Our In-Depth Review of Databox
From a usability perspective, Databox delivers on its promise of no-code BI for most common marketing, sales, and operations use cases. The drag-and-drop dashboard builder, pre-built templates, and metric library make it straightforward to get started, even for non-technical users. Unlimited users on all plans is a major plus, as it removes friction when rolling out dashboards across an organization or agency clients.
Functionally, Databox strikes a strong balance between simplicity and depth. For basic reporting, native integrations and templates cover the majority of needs, while datasets, database connections, and advanced filtering support more sophisticated analysis. AI performance summaries and smart alerts add a modern layer of intelligence, helping teams move from passive reporting to proactive decision-making. The platform’s focus on agencies, with client workspaces and white-label options, is also a clear differentiator.
However, Databox is not without trade-offs. Teams with extremely complex data models or heavy custom SQL requirements may still find more traditional BI tools like Tableau or Power BI more flexible. Pricing based on data sources can become significant for organizations with many properties, accounts, or fragmented tools, even though user seats are unlimited. Additionally, some advanced features such as OKRs, advanced security, and dedicated analyst support are available only as add-ons or on higher tiers.
Overall, Databox is best suited for scaling SaaS companies, digital agencies, and ecommerce brands that want to centralize performance metrics quickly and keep teams aligned. It offers a compelling mix of ease-of-use, integrations, and automation that can significantly reduce reporting overhead. For organizations that prioritize speed, accessibility, and collaborative decision-making over highly customized, query-heavy analytics, Databox is a strong contender in the modern BI landscape.
Pros
- Unlimited users on every plan, making it easy to roll out across teams and clients
- Extensive library of 130+ integrations covering major marketing, sales, finance, and support tools
- No-code metric builder and datasets reduce reliance on SQL and engineering resources
- Drag-and-drop dashboards and 200+ templates accelerate time-to-value
- AI performance summaries and smart alerts help teams act on insights faster
- Strong agency features, including unlimited client accounts and white-label options
- Automated reports and notifications via email, Slack, and mobile improve alignment
- Goals, benchmarks, and forecasts connect day-to-day metrics with strategic planning
- Support for spreadsheets, APIs, Zapier, and Make covers long-tail and custom data sources
- Clear documentation, help center, and community resources support onboarding and adoption
Cons
- Pricing is tied to the number of data sources, which can add up for complex stacks
- Some advanced capabilities (e.g., OKRs, advanced security, dedicated analyst) are add-ons or higher-tier features
- Highly specialized or deeply custom analytics may still require traditional BI tools
- 404 pages for some legacy URLs (e.g., /features, /contact) can make navigation slightly confusing
- Learning curve exists for fully leveraging datasets and advanced filtering, especially for non-analysts

Final Verdict: Is Databox Worth It?
Databox earns a 4.4 out of 5 in this review for delivering accessible, modern BI capabilities to teams that do not want the complexity of legacy tools. Its strengths lie in unlimited users, extensive integrations, no-code metric building, and strong support for agencies and cross-functional teams. The addition of datasets, AI summaries, and smart alerts makes it more than just a dashboarding tool, pushing it toward a full-featured analytics platform.
The main drawbacks are tied to data-source-based pricing and potential limitations for highly advanced, SQL-heavy analytics scenarios. Organizations with many fragmented accounts or very complex data models may need to carefully model costs and evaluate whether Databox can fully replace traditional BI. That said, for most growth-focused SaaS, ecommerce, and agency teams, the trade-offs are favorable.
If you are looking for a way to centralize metrics, automate reporting, and empower non-technical users to explore data, Databox is well worth a trial. The 14-day free Growth trial with no credit card required makes it easy to test dashboards, datasets, and AI features with your own data. Used well, Databox can become a central hub for performance management and data-driven decision-making across your organization.
Alternatives
If Databox isn't the right fit, consider these similar tools:
Last updated: 17.11.2025